Basic Benchmark
The Application Security Component benchmarks were run on an AWS EC2 instance t2.medium (2vCPU/4GiB RAM).
All benchmarks were run with a single routine configured for the Application Security Component.
The benchmarks cover the following tests:
- Basic GET request:
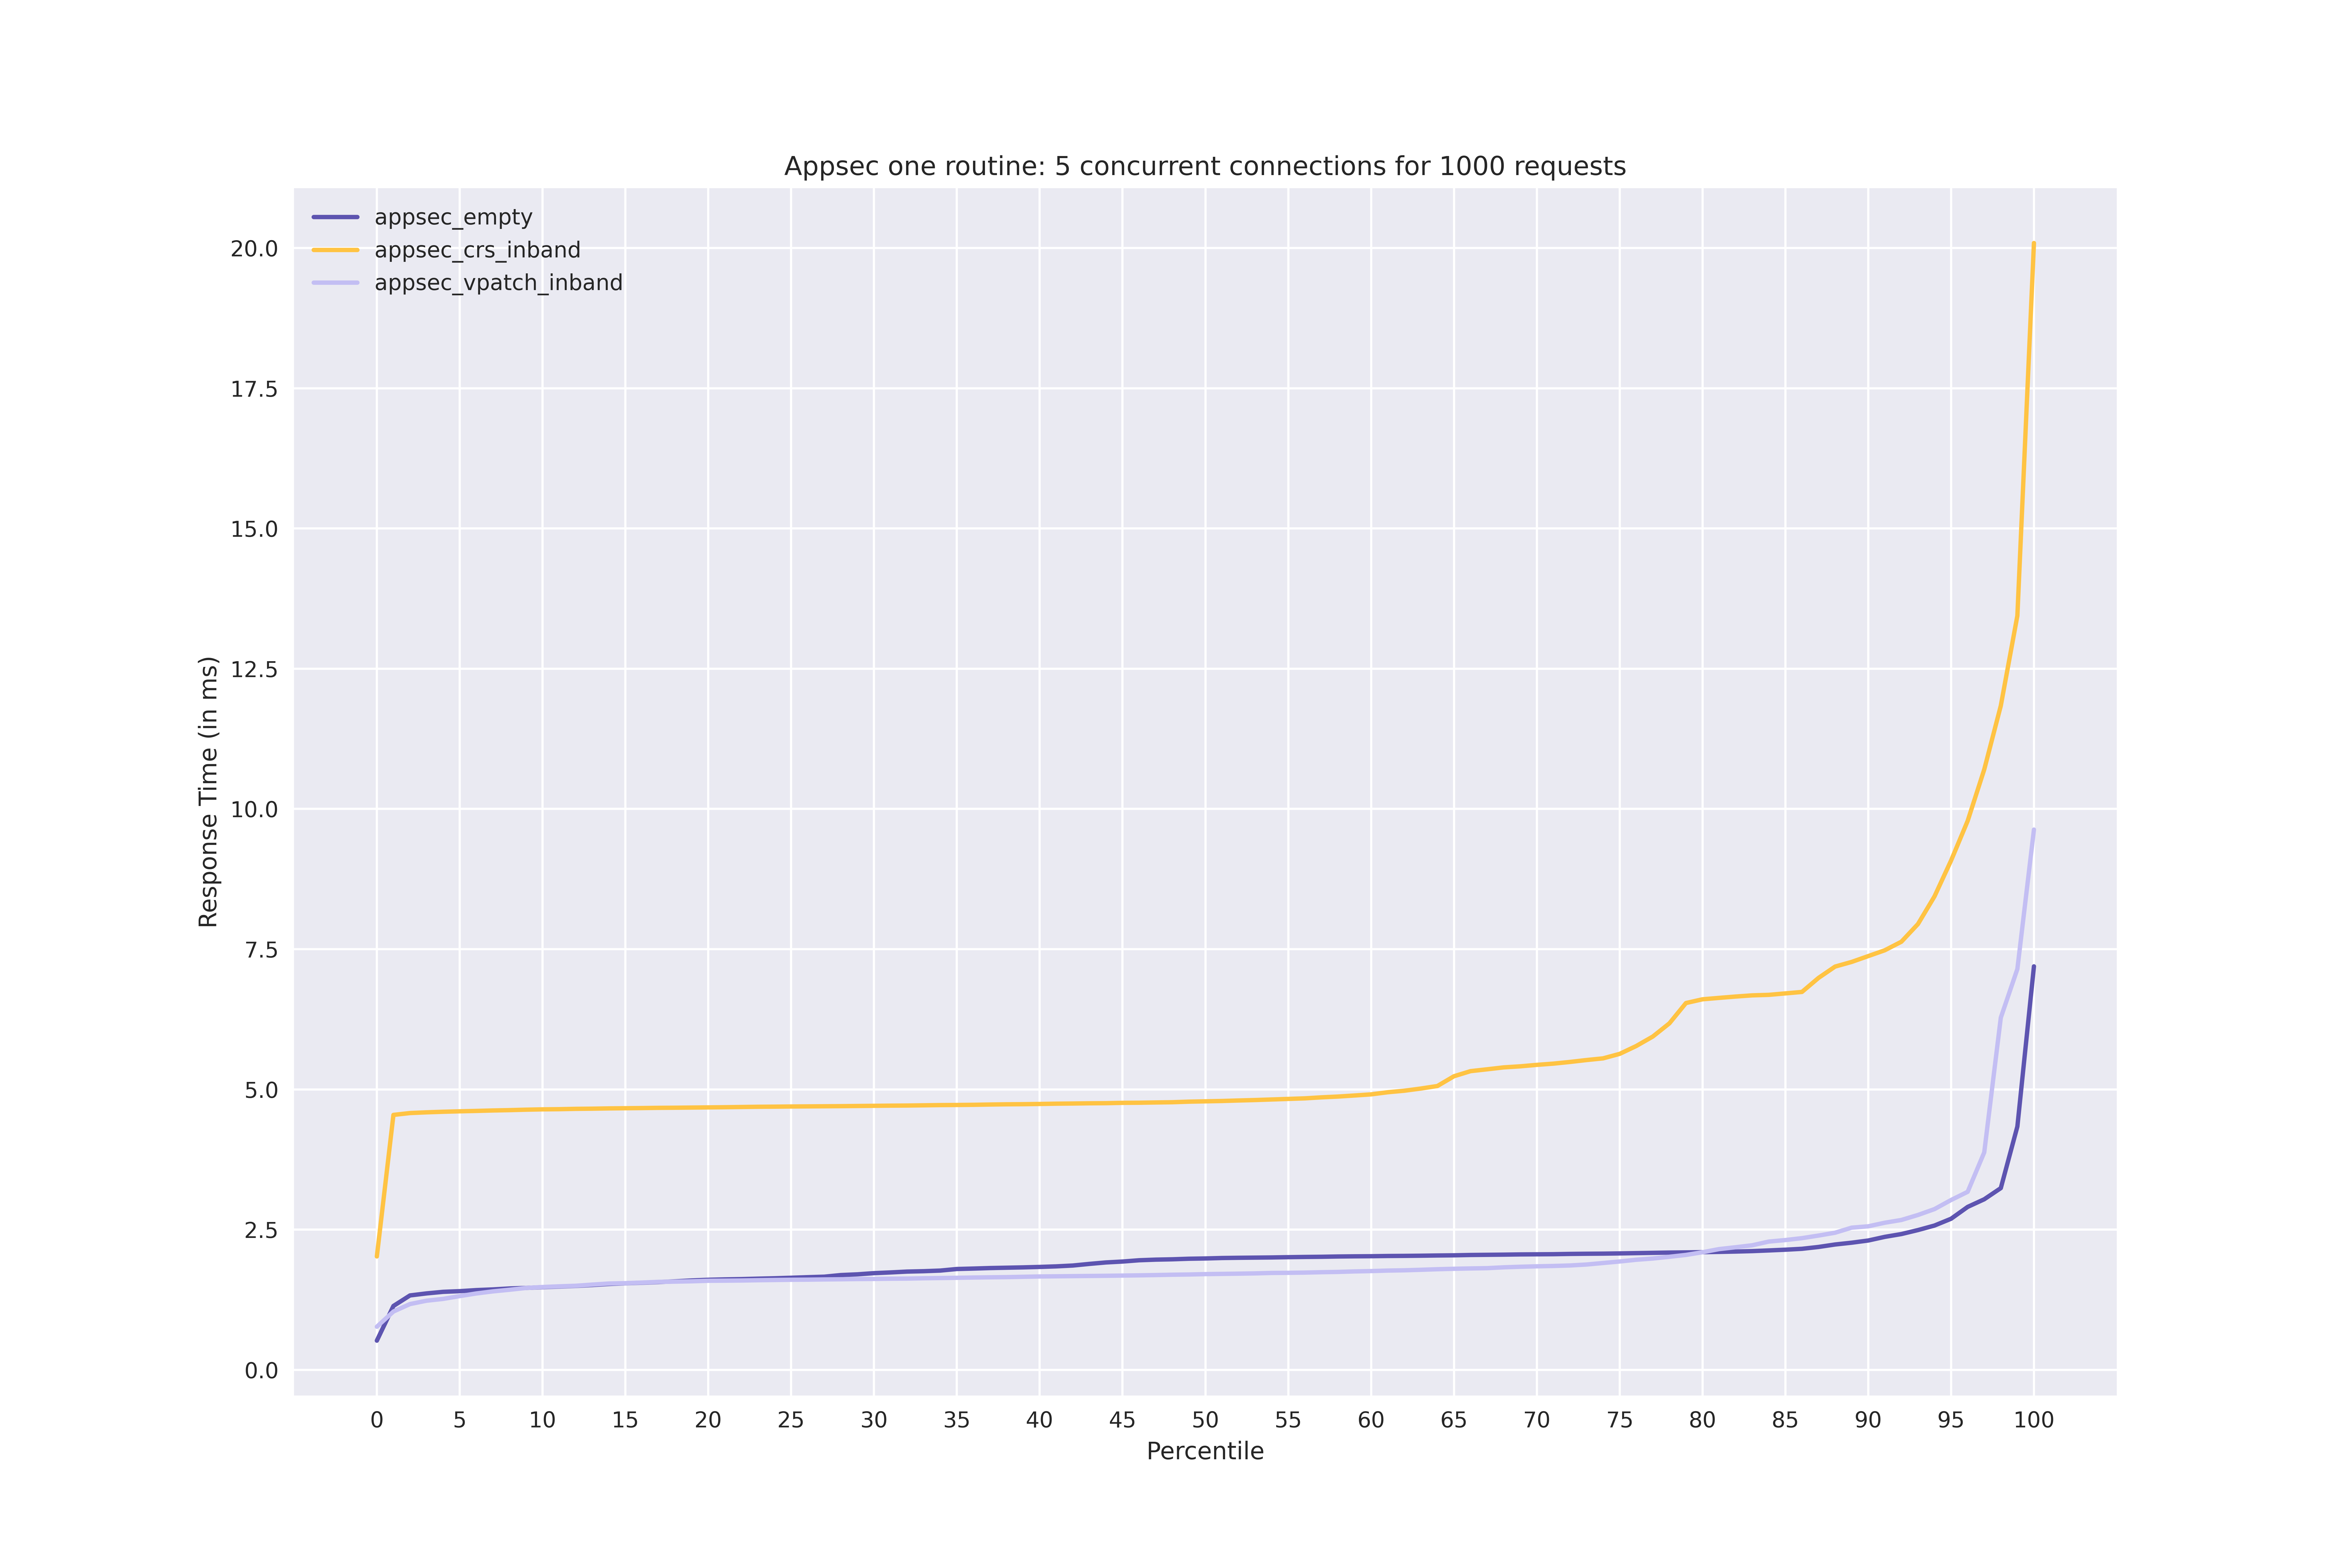
- 5 concurrent connections / 1000 requests
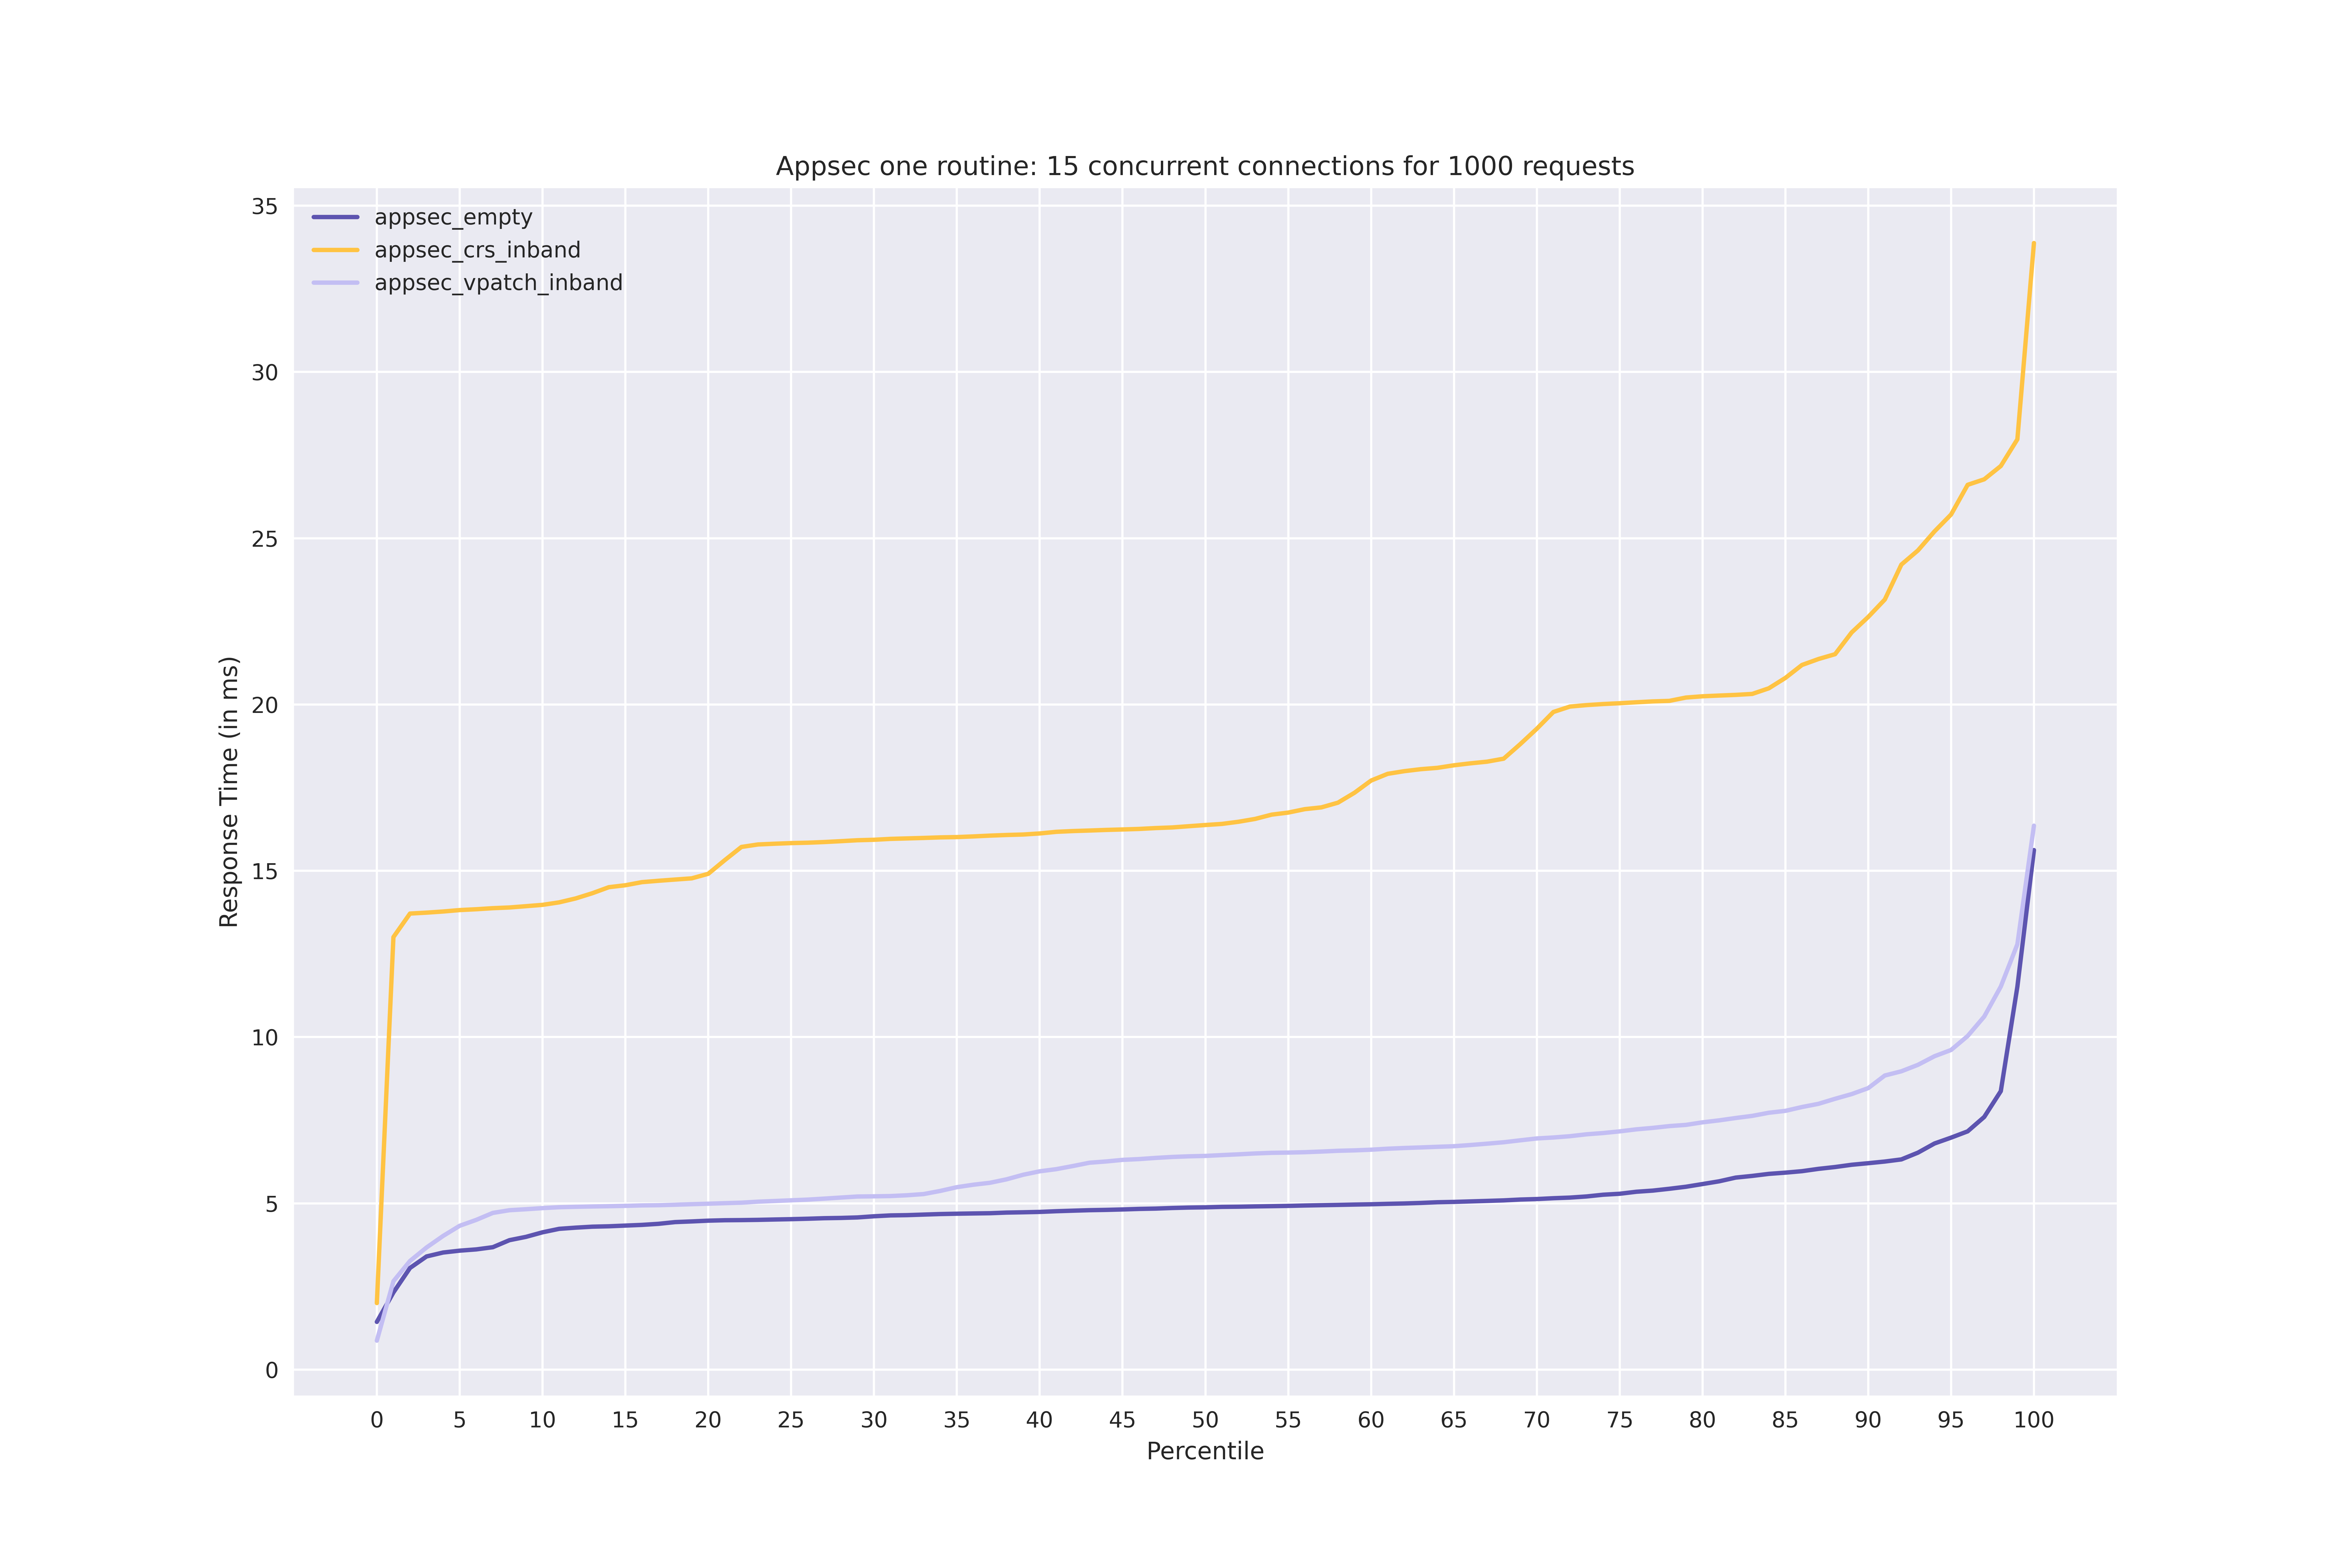
- 15 concurrent connections / 1000 requests
Each test was run with multiple cases:
- Application Security Component enabled but without any rules
- Application Security Component enabled with 100 vpatch rules (in-band)
- Application Security Component enabled with all the CRS (in-band)
On the system, we deployed:
- Openresty
1.21.4.3 - CrowdSec
v1.6.0 - cs-openresty-bouncer
v1.0.1
Basic GET request
5 concurrent connections / 1000 requests

15 concurrent connections / 1000 requests

Stress Test
This test was run on a c5a.4xlarge EC2 instance (16CPU/32GiB RAM).
Tested versions are:
- Openresty
v1.27.1.2 - CrowdSec
v1.7.0 - cs-openresty-bouncer
v1.1.2
Openresty was configured to not log anything and forward requests to a Go backend that always returns 200, to improve raw throughput and avoid disk access limits.
CrowdSec WAF was configured with 16 routines to make use of as much CPU as possible.
All tests were simulating 400 concurrent users, making requests as quickly as possible during 1 minute.
Except for the baseline, all values in the tables are shown as a delta from the baseline performance.
Baseline
This test was run without loading the Openresty bouncer to get a baseline throughput of the system.
GET Requests
| Metric | Value |
|---|---|
| Average Response Time | 23.55ms |
| Minimum Response Time | 21.24ms |
| Median Response Time | 23.18ms |
| Maximum Response Time | 255.16ms |
| P90 Response Time | 24.72ms |
10% POST Requests
| Metric | Value |
|---|---|
| Average Response Time | 25.08ms |
| Minimum Response Time | 21.29ms |
| Median Response Time | 23.95ms |
| Maximum Response Time | 331.08ms |
| P90 Response Time | 30.95ms |
Virtual Patching Rules
GET Requests - 10% malicious - InBand
| Metric | Delta |
|---|---|
| Average Response Time | +4.94ms |
| Minimum Response Time | +0.93ms |
| Median Response Time | +3.48ms |
| Maximum Response Time | +6.83ms |
| P90 Response Time | +10.13ms |
Realistic Traffic - 70% GET - 25% POST - 5% malicious - Inband
| Metric | Delta |
|---|---|
| Average Response Time | +4.03ms |
| Minimum Response Time | +0.71ms |
| Median Response Time | +2.36ms |
| Maximum Response Time | +6.79ms |
| P90 Response Time | +8.07ms |
CRS
GET Requests - 10% malicious - InBand
| Metric | Delta |
|---|---|
| Average Response Time | +32.85ms |
| Minimum Response Time | +2.21ms |
| Median Response Time | +27.47ms |
| Maximum Response Time | -64.45ms |
| P90 Response Time | +58.19ms |
POST Requests - 10% malicious - InBand
| Metric | Delta |
|---|---|
| Average Response Time | +58.49ms |
| Minimum Response Time | +3.18ms |
| Median Response Time | +54.1ms |
| Maximum Response Time | -106.76ms |
| P90 Response Time | +83.01ms |
Realistic Traffic - 70% GET - 25% POST - 5% malicious - Inband
| Metric | Delta |
|---|---|
| Average Response Time | +32.54ms |
| Minimum Response Time | +1.87ms |
| Median Response Time | +28.36ms |
| Maximum Response Time | -68.34ms |
| P90 Response Time | +53.83ms |
Virtual Patching Inband + CRS Out-of-band
Realistic Traffic - 70% GET - 25% POST - 5% malicious
| Metric | Delta |
|---|---|
| Average Response Time | +30.5ms |
| Minimum Response Time | +1.56ms |
| Median Response Time | +26.26ms |
| Maximum Response Time | -101.66ms |
| P90 Response Time | +51.18ms |