Prometheus
CrowdSec can expose a prometheus endpoint for collection (on http://127.0.0.1:6060/metrics by default). You can edit the listen_addr in config.yaml to allow an external Prometheus to scrape the metrics.
The goal of this endpoint, besides the usual resources consumption monitoring, aims at offering a view of CrowdSec "applicative" behavior :
- is it processing a lot of logs ? is it parsing them successfully ?
- are a lot of scenarios being triggered ?
- are a lot of IPs banned ?
- etc.
All the counters are "since CrowdSec start".
Metrics levels
The prometheus configuration accepts a level parameter that controls the verbosity of exposed metrics. The possible values are:
none: no metrics are registeredaggregated: only aggregated metrics are registered (per-machine and per-bouncer LAPI metrics, per-node parser metrics, decision/alert gauges, and LAPI response time are not available)full(default) : all metrics are registered
Acquisition metrics are registered per datasource — they only appear when the corresponding datasource is configured.
Metrics details
Scenarios
cs_buckets: number of buckets that currently exist (Gauge, labels:name)cs_bucket_instantiation_total: total number of instantiation of each scenario (Counter, labels:name)cs_bucket_overflowed_total: total number of overflow of each scenario (Counter, labels:name)cs_bucket_underflowed_total: total number of underflow of each scenario — bucket was created but expired because of lack of events (Counter, labels:name)cs_bucket_canceled_total: total number of canceled buckets (Counter, labels:name)cs_bucket_poured_total: total number of events poured to each scenario (Counter, labels:source,type,name)
example
#2030 lines from `/var/log/nginx/access.log` were poured to `crowdsecurity/http-scan-uniques_404` scenario
cs_bucket_poured_total{name="crowdsecurity/http-scan-uniques_404",source="/var/log/nginx/access.log",type="nginx"} 2030
Parsers
cs_node_hits_total: how many times an event from a specific source was processed by a parser node (Counter, labels:source,type,name,stage,acquis_type)
example
# 235 lines from `auth.log` were processed by the `crowdsecurity/dateparse-enrich` parser
cs_node_hits_total{name="crowdsecurity/dateparse-enrich",source="/var/log/auth.log",type="syslog",stage="s01-parse",acquis_type="file"} 235
cs_node_hits_ko_total: how many times an event from a specific source was unsuccessfully parsed by a specific parser (Counter, labels:source,type,name,stage,acquis_type)
example
# 2112 lines from `error.log` failed to be parsed by `crowdsecurity/http-logs`
cs_node_hits_ko_total{name="crowdsecurity/http-logs",source="/var/log/nginx/error.log",type="nginx",stage="s01-parse",acquis_type="file"} 2112
-
cs_node_hits_ok_total: how many times an event from a specific source was successfully parsed by a specific parser (Counter, labels:source,type,name,stage,acquis_type) -
cs_node_wl_hits_total: how many times an event was processed by a whitelist node (Counter, labels:source,type,name,reason,stage,acquis_type) -
cs_node_wl_hits_ok_total: how many times an event was successfully whitelisted by a node (Counter, labels:source,type,name,reason,stage,acquis_type) -
cs_parser_hits_total: how many times an event from a source has hit the parser (Counter, labels:source,type) -
cs_parser_hits_ok_total: how many times an event from a source was successfully parsed (Counter, labels:source,type,acquis_type) -
cs_parser_hits_ko_total: how many times an event from a source was unsuccessfully parsed (Counter, labels:source,type,acquis_type)
Processing
cs_parsing_time_seconds: time spent parsing a line (Histogram, labels:type,source)cs_bucket_pour_seconds: time spent pouring an event to buckets (Histogram, labels:type,source)
Decisions & Alerts
cs_active_decisions: number of active decisions (Gauge, labels:reason,origin,action)cs_alerts: number of alerts, excluding CAPI (Gauge, labels:reason)
Application Security Engine
cs_appsec_reqs_total: total events processed by the Application Security Engine (Counter, labels:source,appsec_engine)cs_appsec_block_total: total events blocked by the Application Security Engine (Counter, labels:source,appsec_engine)cs_appsec_rule_hits: count of triggered rules (Counter, labels:rule_name,type,appsec_engine,source)cs_appsec_parsing_time_seconds: time spent processing a request by the Application Security Engine (Histogram, labels:source,appsec_engine)cs_appsec_inband_parsing_time_seconds: time spent processing a request by the inband Application Security Engine (Histogram, labels:source,appsec_engine)cs_appsec_outband_parsing_time_seconds: time spent processing a request by the outband Application Security Engine (Histogram, labels:source,appsec_engine)cs_appsec_challenge_requested_total: challenges served by the AppSec component (Counter, labels:source,appsec_engine)cs_appsec_challenge_submitted_total: challenge responses received by the AppSec component (Counter, labels:source,appsec_engine)cs_appsec_challenge_accepted_total: challenge cookies issued —kind=solvedfor valid submissions (emptyreason),kind=grantedforGrantChallengeCookie(reason)(Counter, labels:source,appsec_engine,kind,reason)cs_appsec_challenge_rejected_total: challenge / cookie rejections —kind=protocolfor crypto-PoW failures,kind=submissionforRejectSubmission(reason),kind=cookiefor invalid incoming cookies (Counter, labels:source,appsec_engine,kind,reason)cs_appsec_challenge_exempt_total: requests exempted from the challenge byExemptFromChallenge(reason)— a verified known bot (e.g.gptbot) or a well-known path class. Counted once per request (Counter, labels:source,appsec_engine,reason)cs_appsec_fingerprint_mismatch_total: fingerprint mismatch signals fired, as reported byEvaluateMismatches()(Counter, labels:reason,severity,appsec_engine)
The following counters track the internals of the challenge runtime rather than the traffic itself, and are mostly useful to troubleshoot its CPU and memory usage:
cs_appsec_challenge_kepoch_generated_total: per-epoch challenge signing keys derived (Counter)cs_appsec_challenge_kepoch_evicted_total: per-epoch challenge signing keys evicted from the keyring cache — generated minus evicted is the live cache size (Counter)cs_appsec_challenge_reobfuscation_total: JS obfuscation passes run by the challenge runtime,bundle=dynamicbeing the per-epoch sign-key module (Counter, labels:bundle)cs_appsec_challenge_dynamic_module_evicted_total: per-epoch dynamic modules evicted once their epoch left the keyring live window (Counter)
Acquisition
Acquisition metrics are split by datasource. They only appear when the corresponding datasource is configured. The following metrics are available :
Cloudwatch
cs_cloudwatch_openstreams_total: number of opened streams within group (Gauge, labels:group)cs_cloudwatch_stream_hits_total: number of events read from stream (Counter, labels:group,stream)
Docker
cs_dockersource_hits_total: total lines that were read (Counter, labels:source)
Files
cs_filesource_hits_total: total lines that were read (Counter, labels:source)
HTTP
cs_httpsource_hits_total: total lines that were read from HTTP source (Counter, labels:path,src)
Journald
cs_journalctlsource_hits_total: total lines that were read (Counter, labels:source)
Kafka
cs_kafkasource_hits_total: total lines that were read from topic (Counter, labels:topic)
Kinesis
cs_kinesis_stream_hits_total: number of events read per stream (Counter, labels:stream)cs_kinesis_shards_hits_total: number of events read per shard (Counter, labels:stream,shard)
Kubernetes
cs_kubernetessource_hits_total: total lines that were read (Counter, labels:source,datasource_type,acquis_type)
Kubernetes Audit
cs_k8sauditsource_hits_total: total number of events received by k8s-audit source (Counter, labels:source)cs_k8sauditsource_requests_total: total number of requests received (Counter, labels:source)
Loki
cs_lokisource_hits_total: total lines that were read (Counter, labels:source)
S3
cs_s3_hits_total: number of events read per bucket (Counter, labels:bucket)cs_s3_objects_total: number of objects read per bucket (Counter, labels:bucket)cs_s3_sqs_messages_total: number of SQS messages received per queue (Counter, labels:queue)
Syslog
cs_syslogsource_hits_total: total lines that were received (Counter, labels:source)cs_syslogsource_parsed_total: total lines that were successfully parsed by the syslog server (Counter, labels:source,type)
VictoriaLogs
cs_victorialogssource_hits_total: total lines that were read (Counter, labels:source)
Windows EventLog
cs_winevtlogsource_hits_total: total events that were read (Counter, labels:source)
Local API
cs_lapi_route_requests_total: number of calls to each route per method (Counter, labels:route,method)cs_lapi_machine_requests_total: number of calls to each route per method grouped by machines (Counter, labels:machine,route,method)cs_lapi_bouncer_requests_total: number of calls to each route per method grouped by bouncers (Counter, labels:bouncer,route,method)cs_lapi_decisions_ko_total: number of calls to /decisions that returned nil result (Counter, labels:bouncer)cs_lapi_decisions_ok_total: number of calls to /decisions that returned non-nil result (Counter, labels:bouncer)cs_lapi_request_duration_seconds: response time of LAPI (Histogram, labels:endpoint,method)cs_machines_last_heartbeat_timestamp: unix timestamp of the last heartbeat received from a machine (Gauge, labels:machine)
Cache
cs_cache_size: entries per cache (Gauge, labels:name,type)cs_regexp_cache_size: entries per regexp cache (Gauge, labels:name)
Info
cs_info: Information about CrowdSec (software version)
More ways to learn

Watch a short series of videos on how to observe and monitor CrowdSec.
Learn with CrowdSec AcademyExploitation with prometheus server & grafana
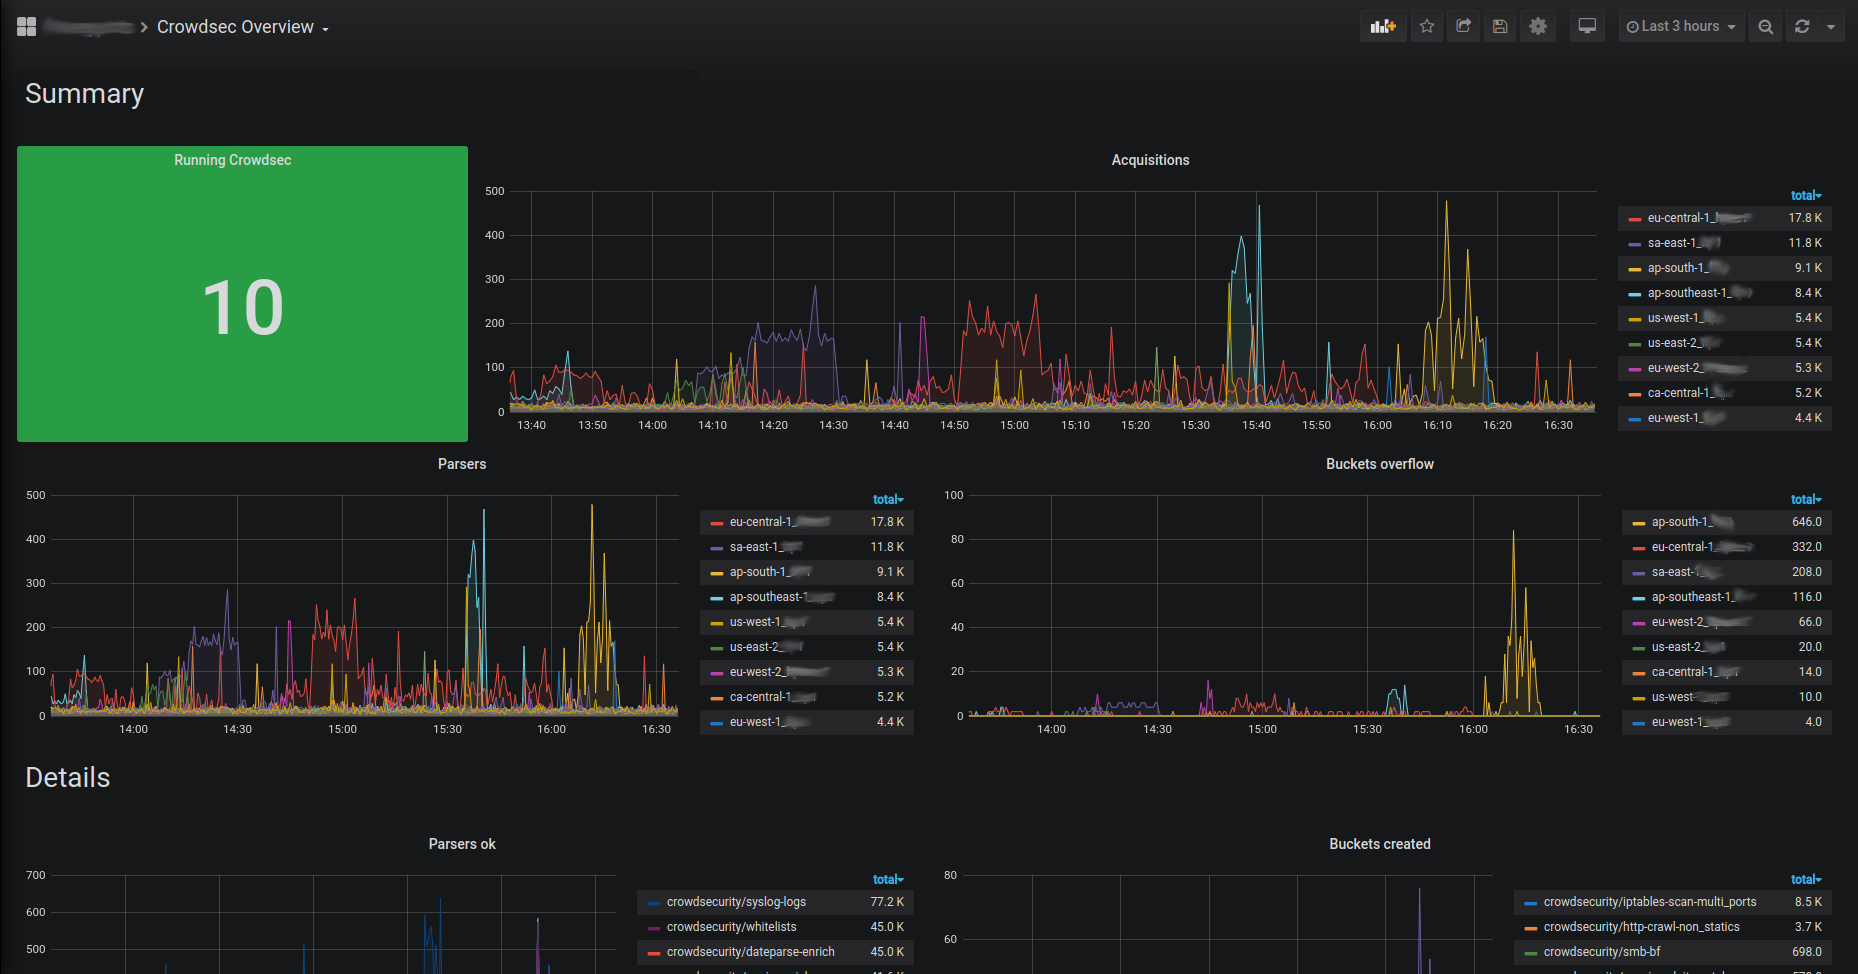
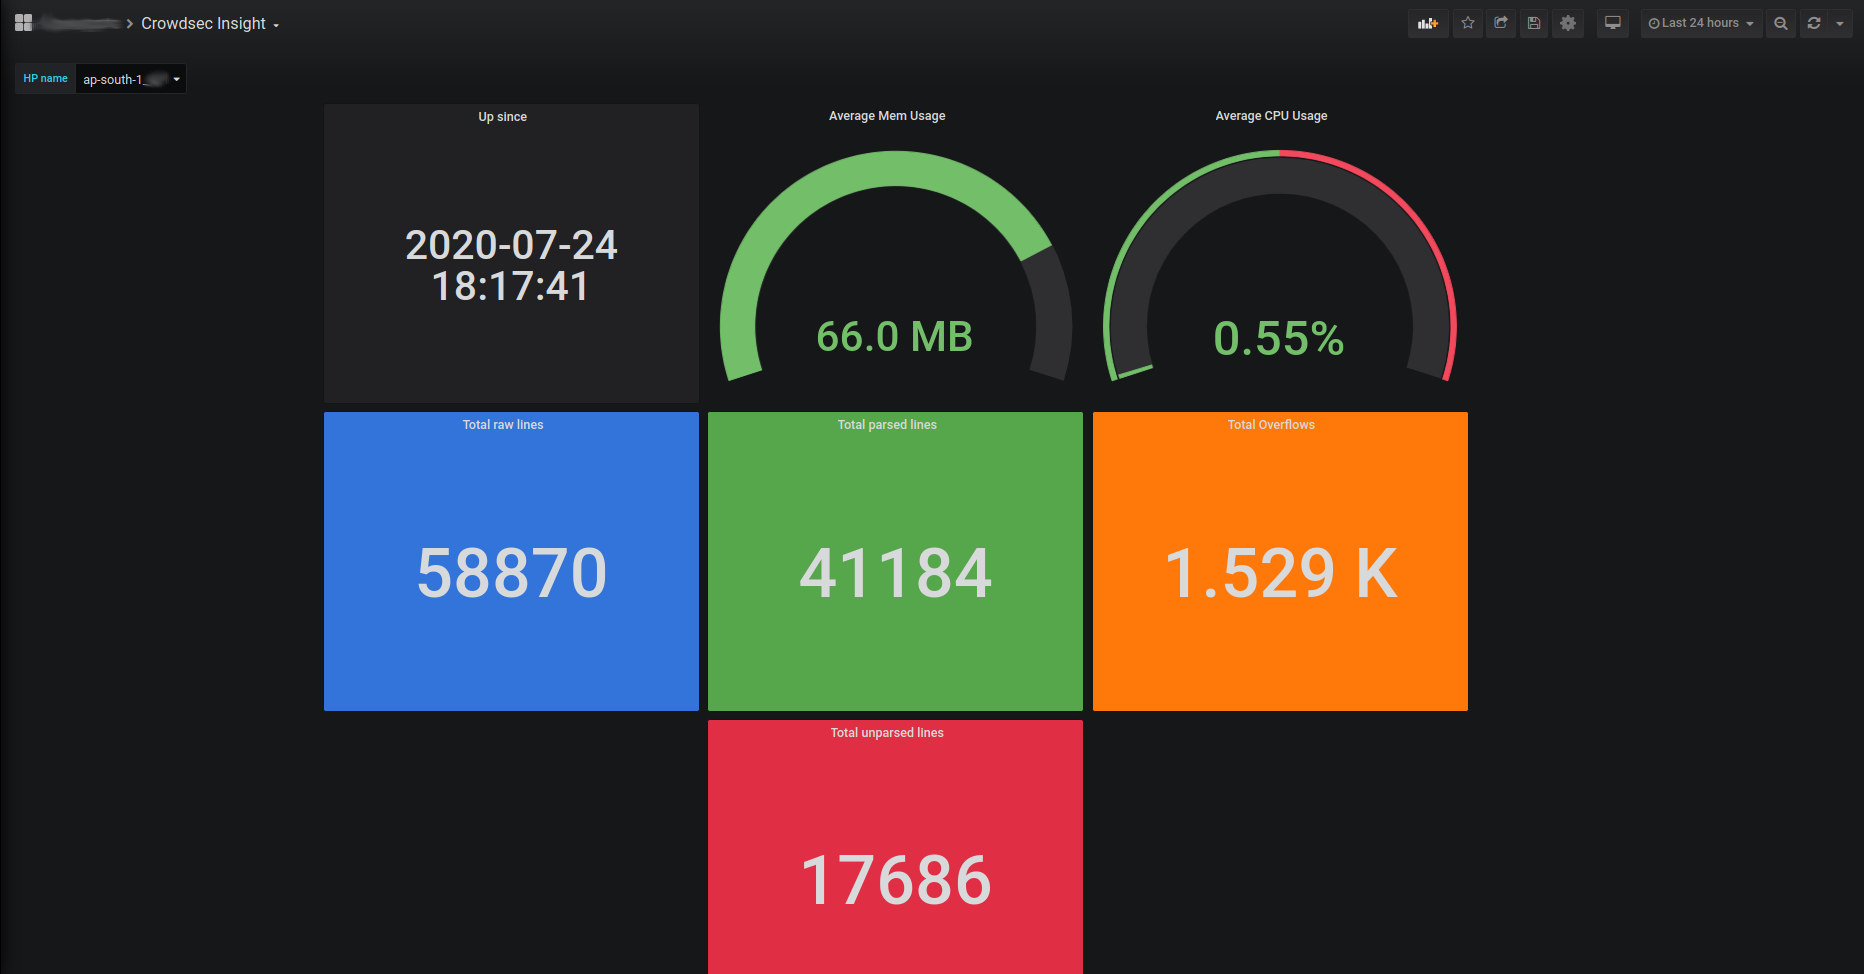
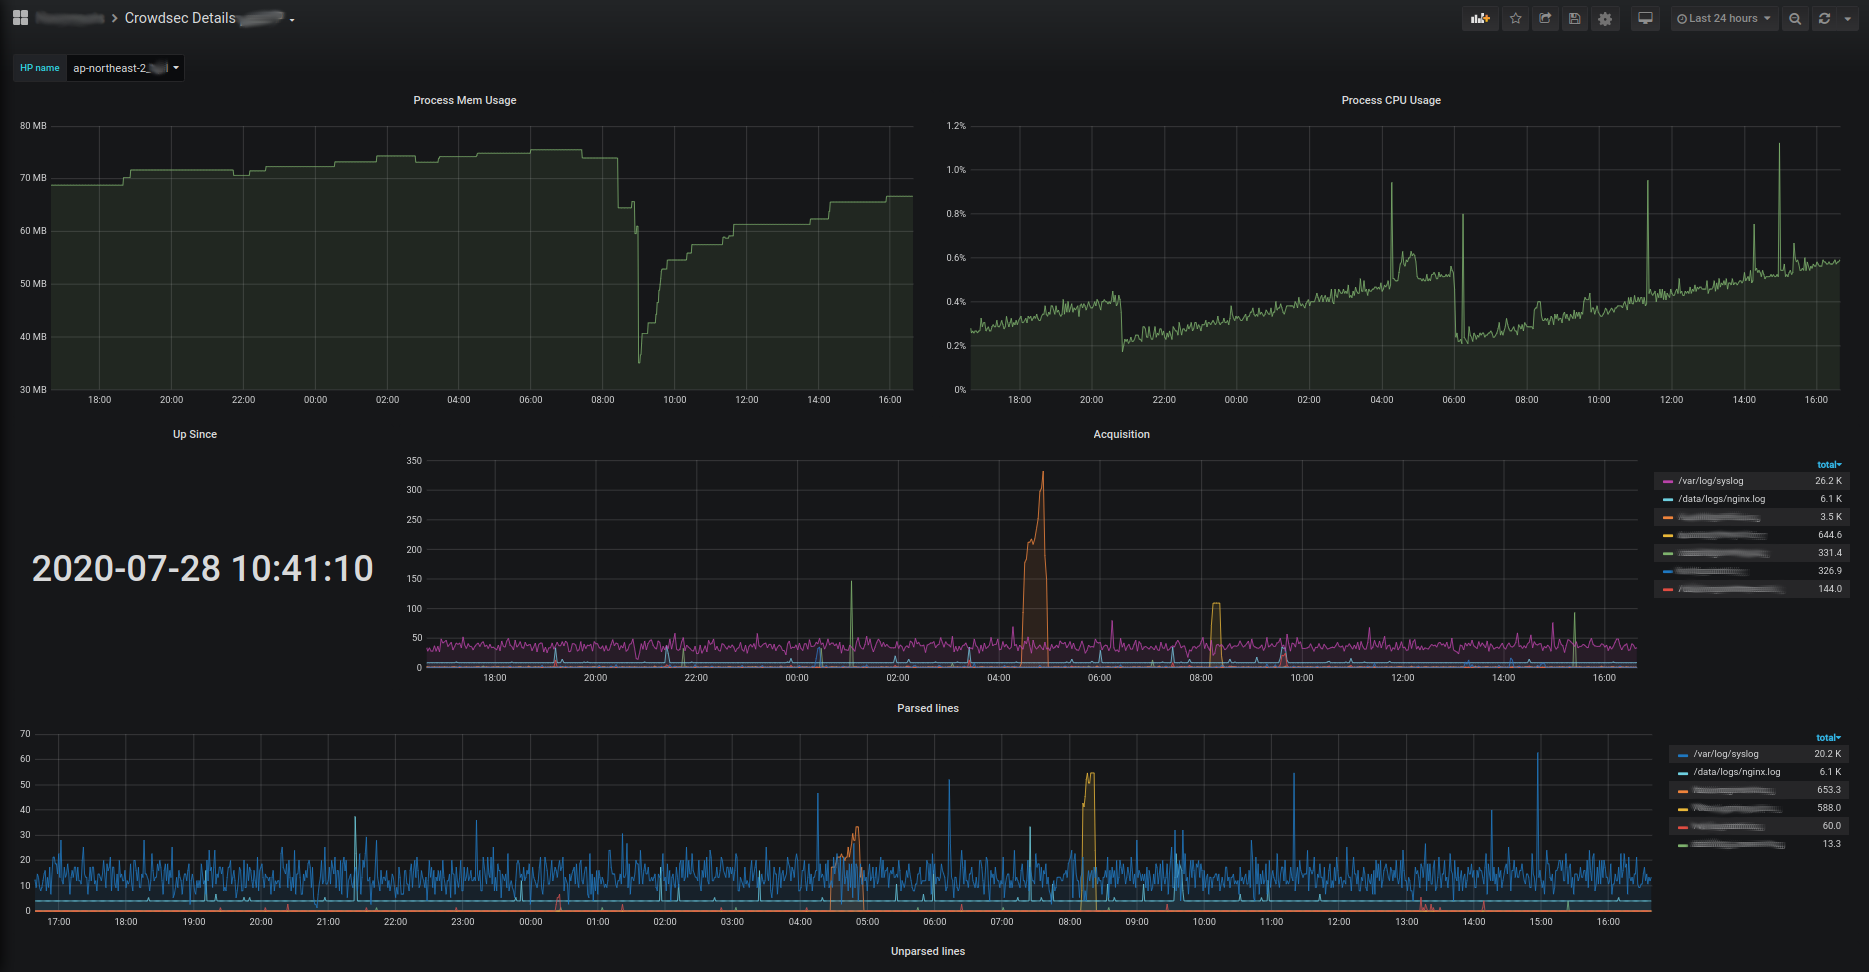
Those metrics can be scraped by prometheus server and visualized with grafana. They can be downloaded here :