Am I Attacking
Your Security Engines tell you who attacks you. Am I Attacking tells you when the attacker is one of your own IPs: a compromised server, a hijacked workstation, a scanner that got out of hand. Declare the addresses you operate, and every attack the CrowdSec network reports against them lands in the Console and in your notification rules.
Declaring addresses records the events in the Console, but nothing leaves it until a notification rule carries the Am I Attacking event. The page warns you as long as no rule does, and offers to create one.
Where to find it
Am I Attacking lives in the IP Reputation / CTI section of the Console, at app.crowdsec.net/am-i-attacking. It is a Premium feature: a Community organization sees what it unlocks and a button to the pricing page, with a 30-day free trial.
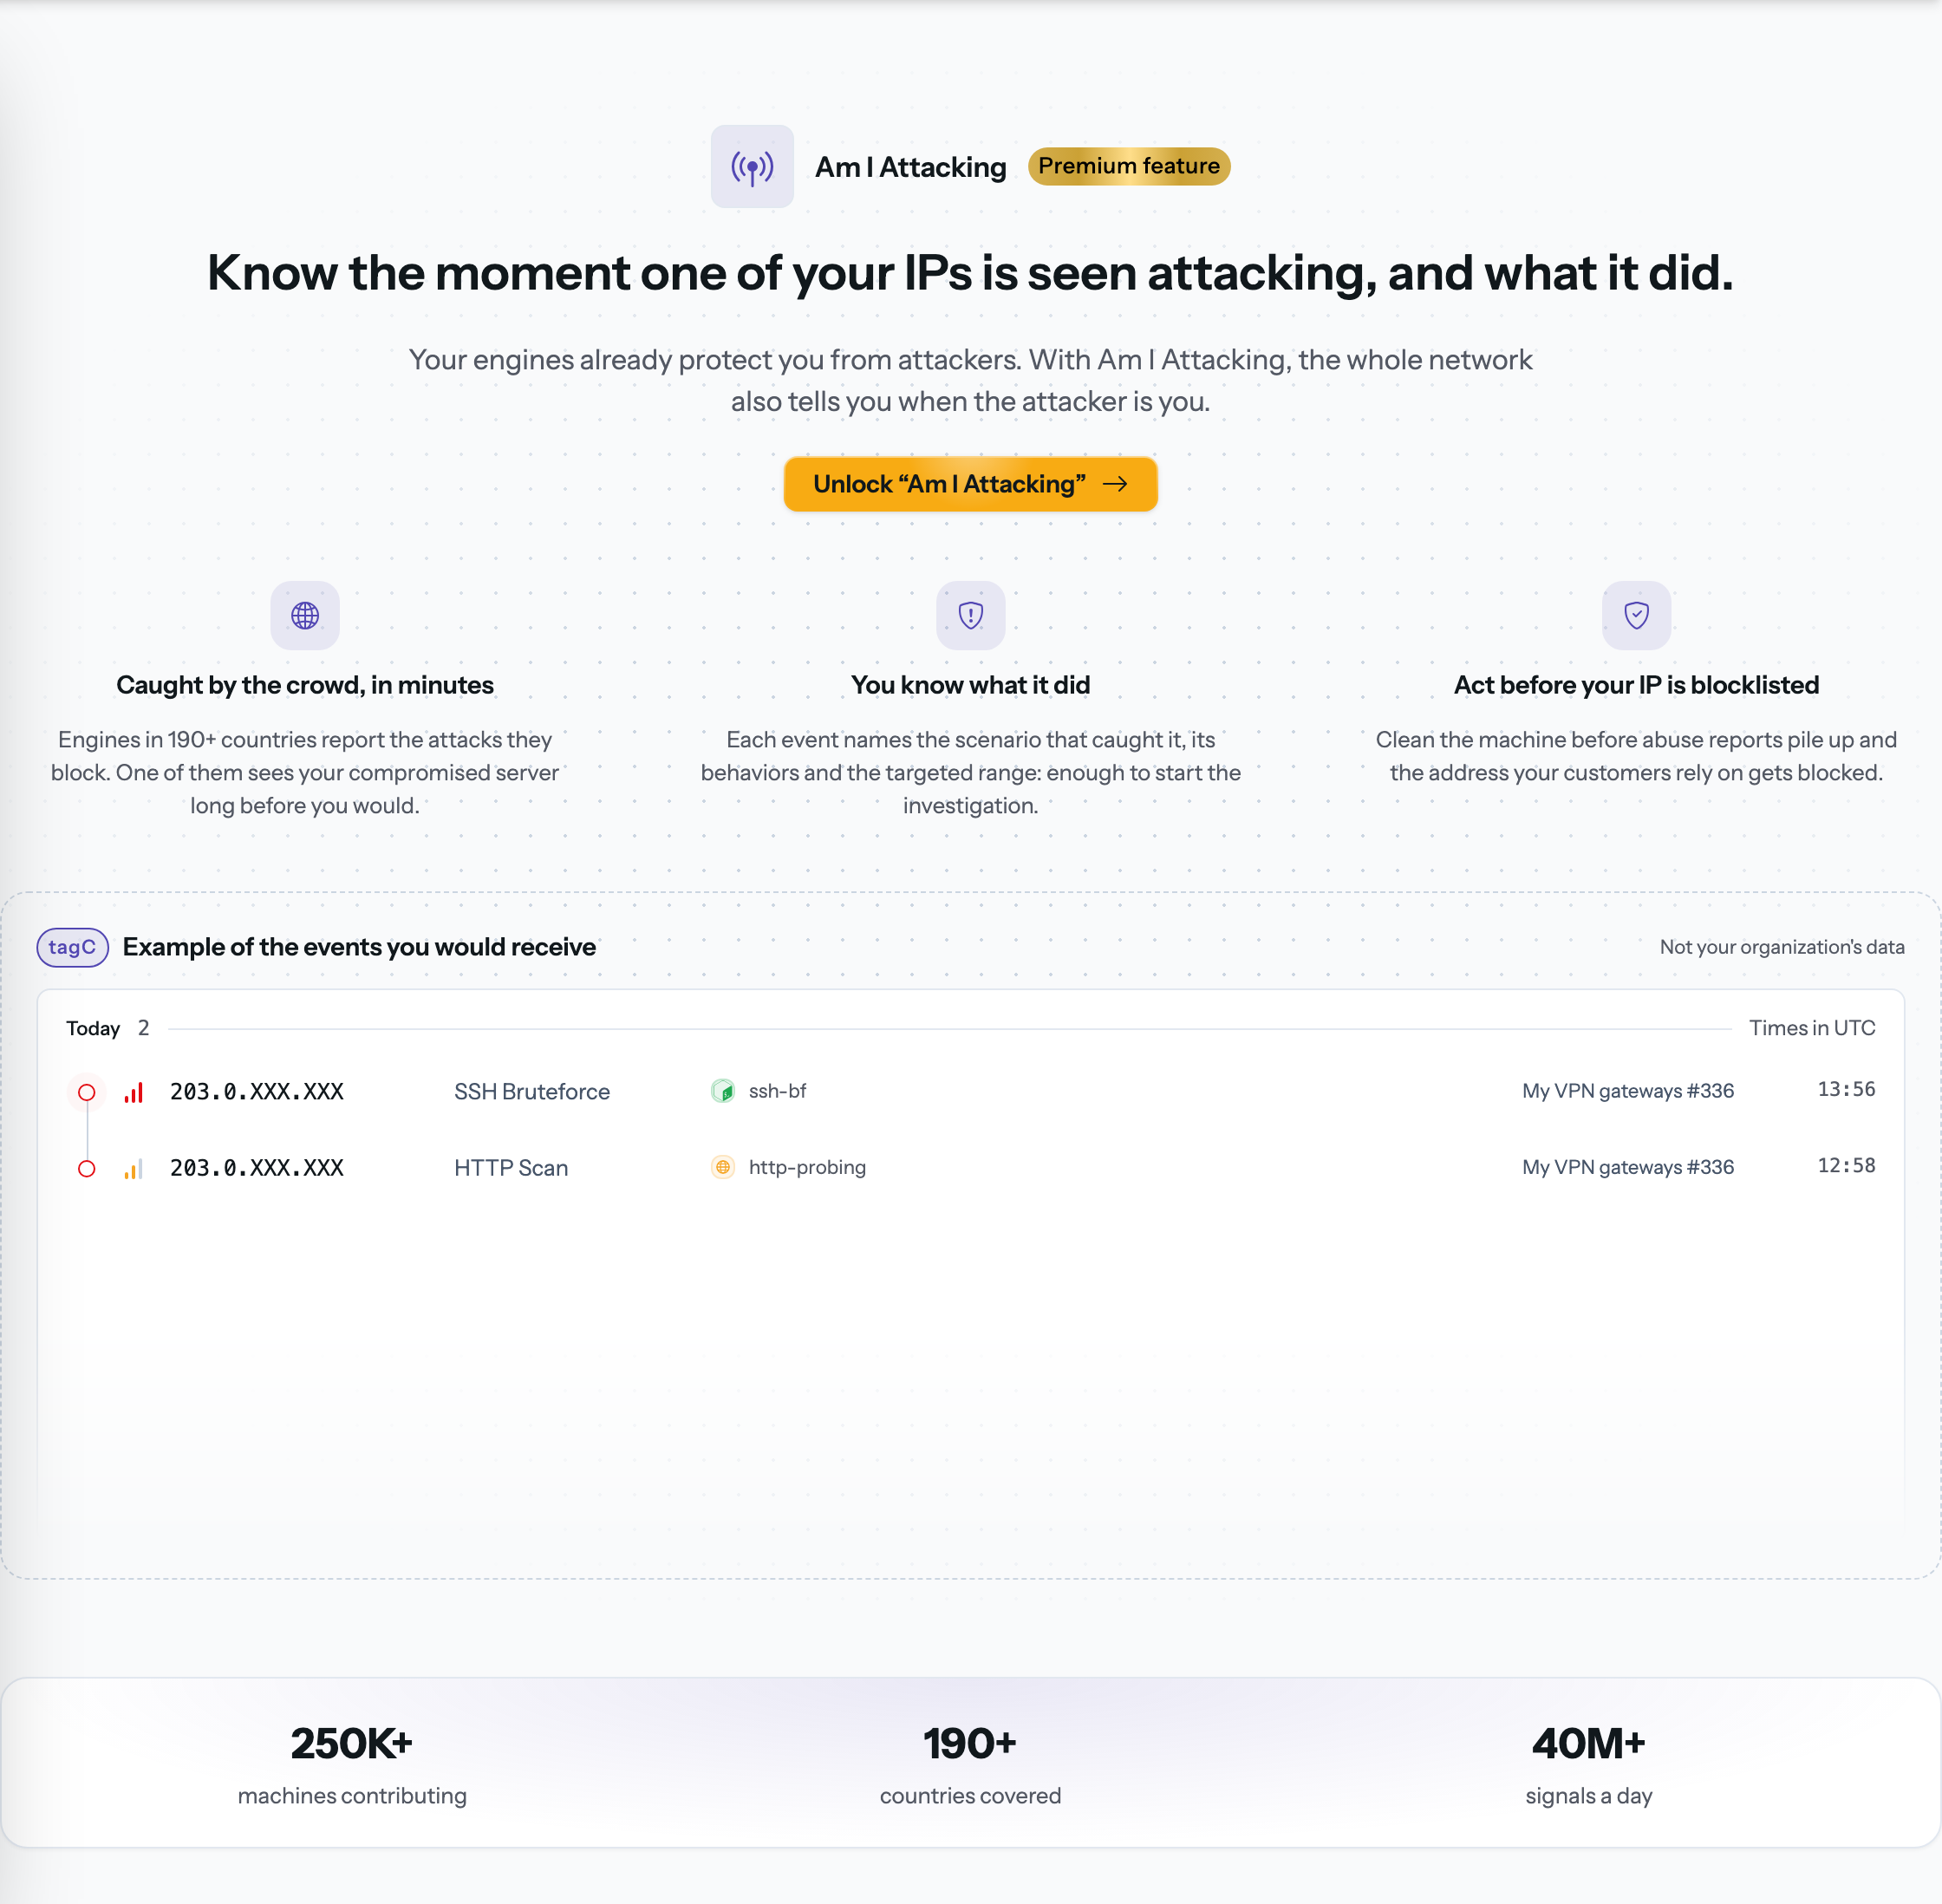
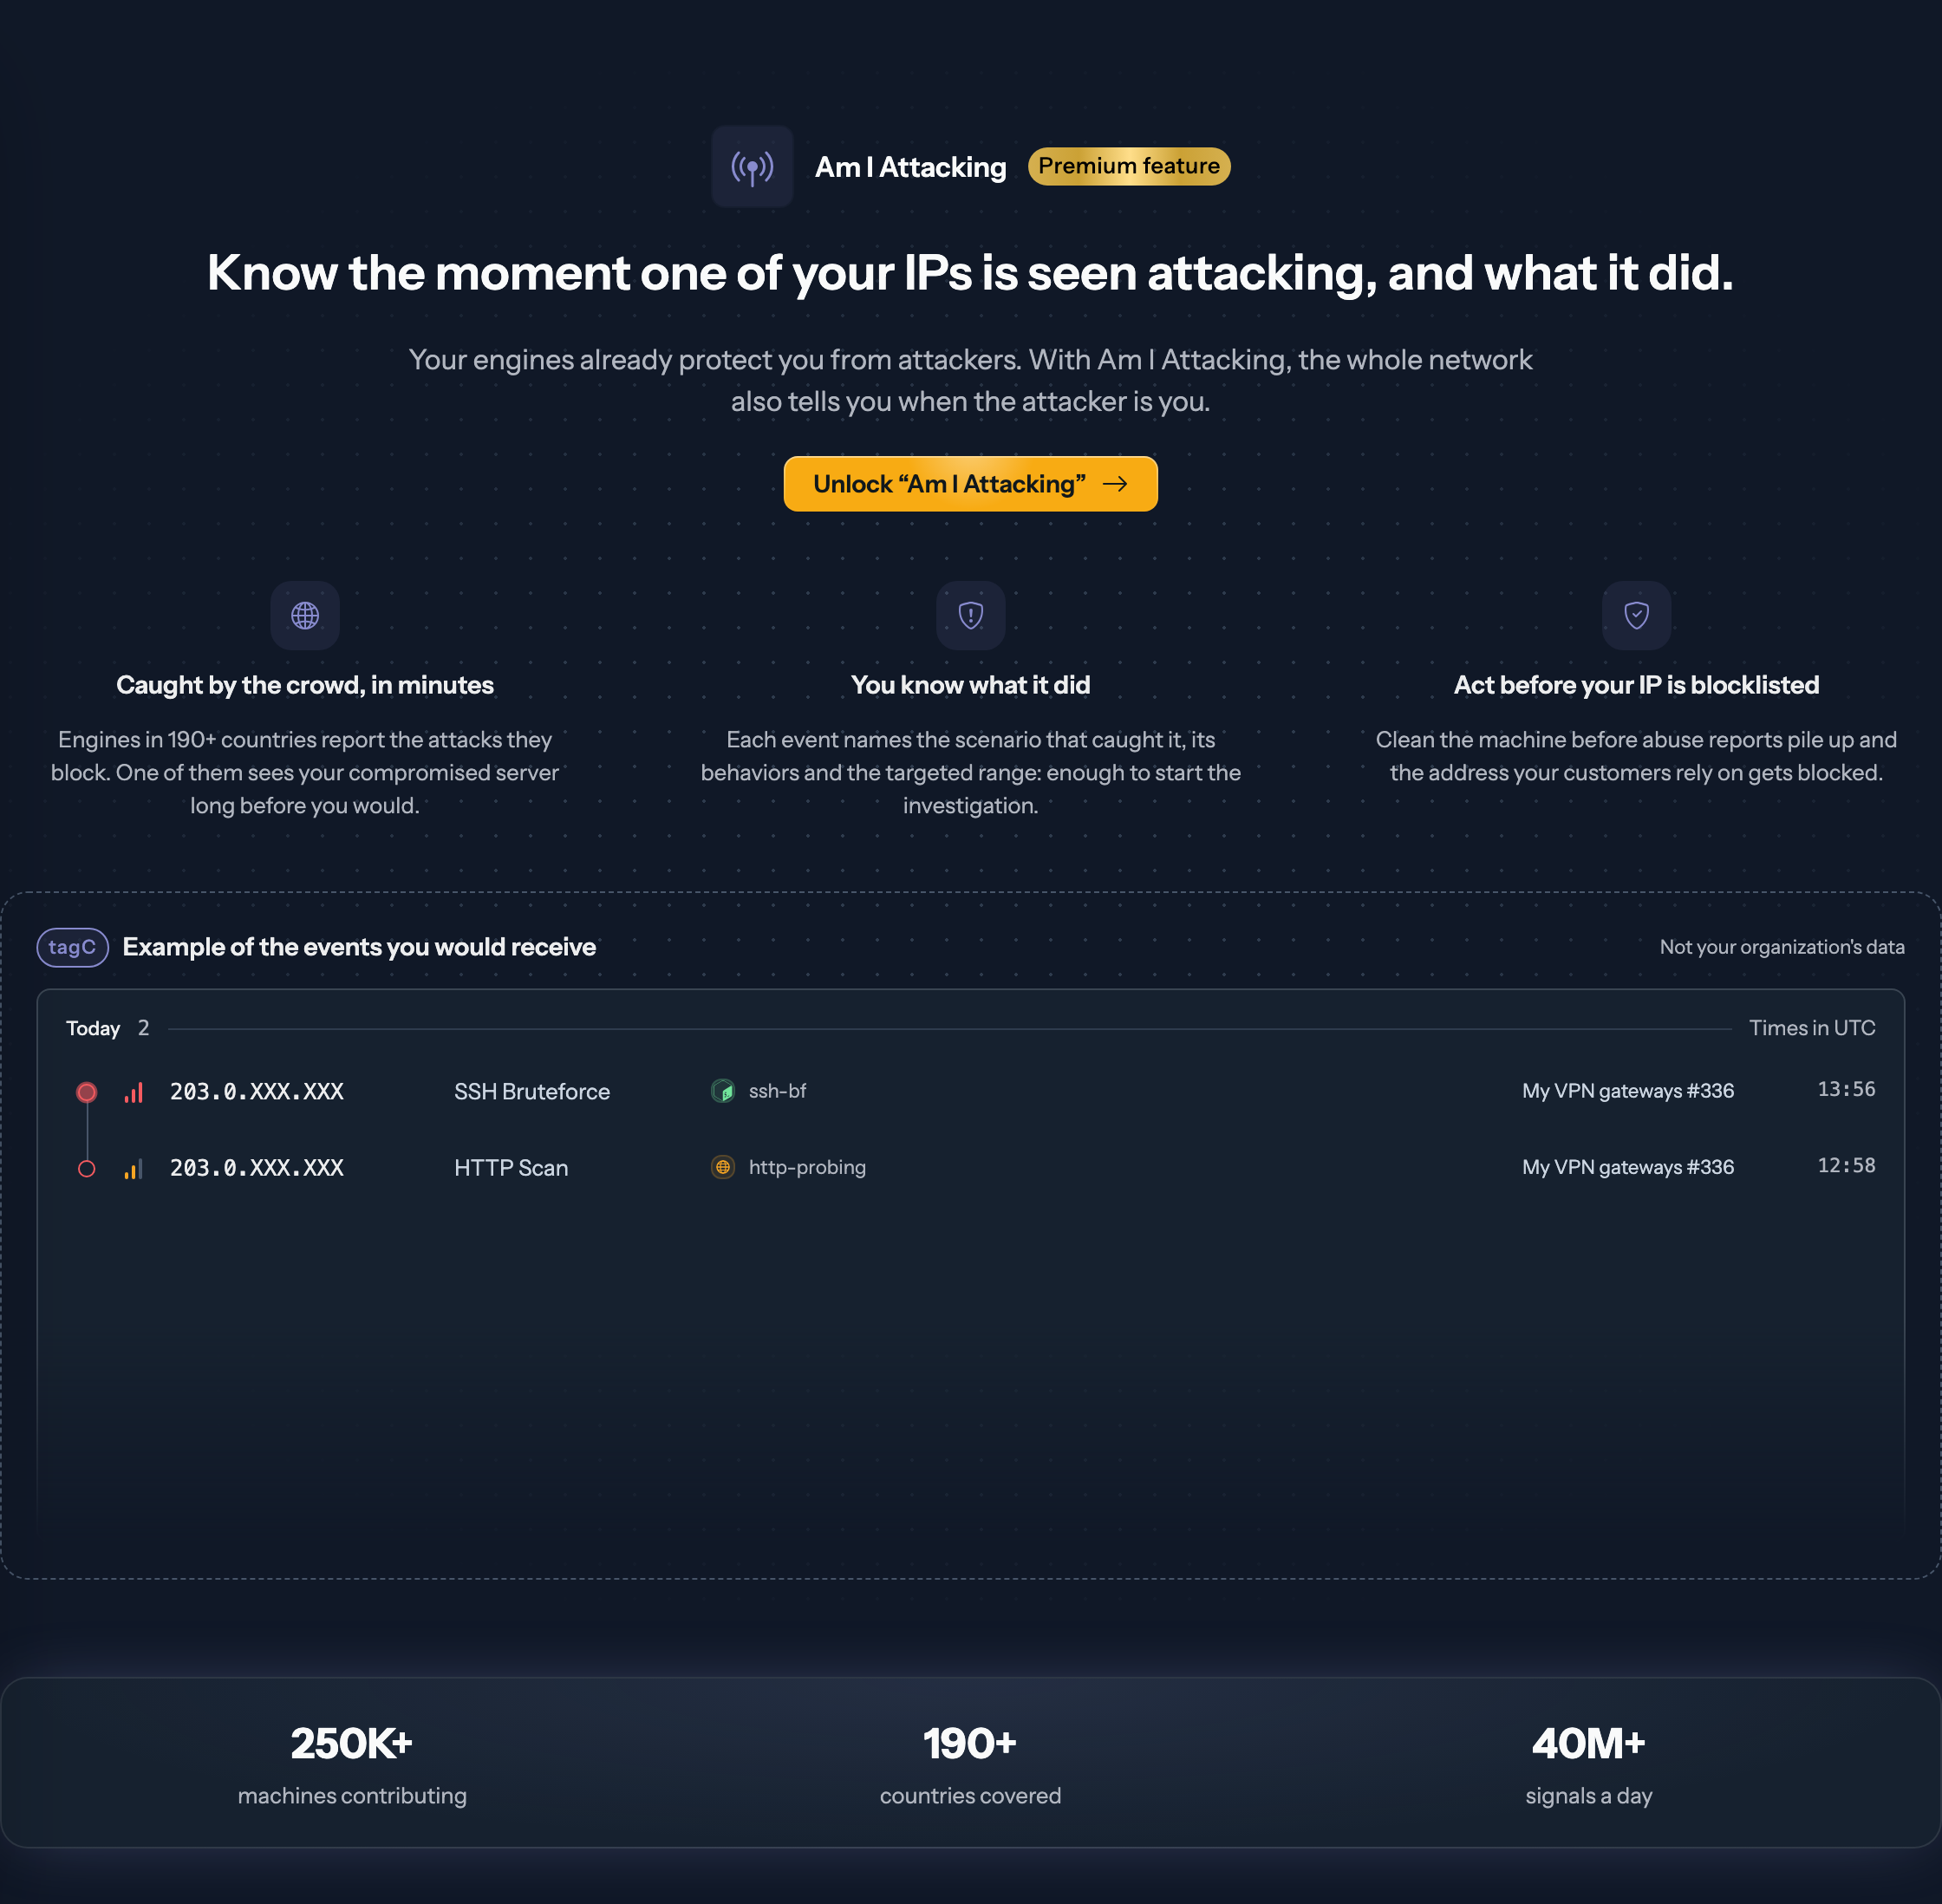
The command palette (⌘K) opens the page, and on a Premium organization also offers Add an Am I Attacking configuration and Am I Attacking configurations. Editors and owners create and change configurations; viewers read everything.
Declare the IPs to monitor
Click Configurations in the page header, then Add a configuration. A configuration carries a name, the addresses to watch and a deduplication window.
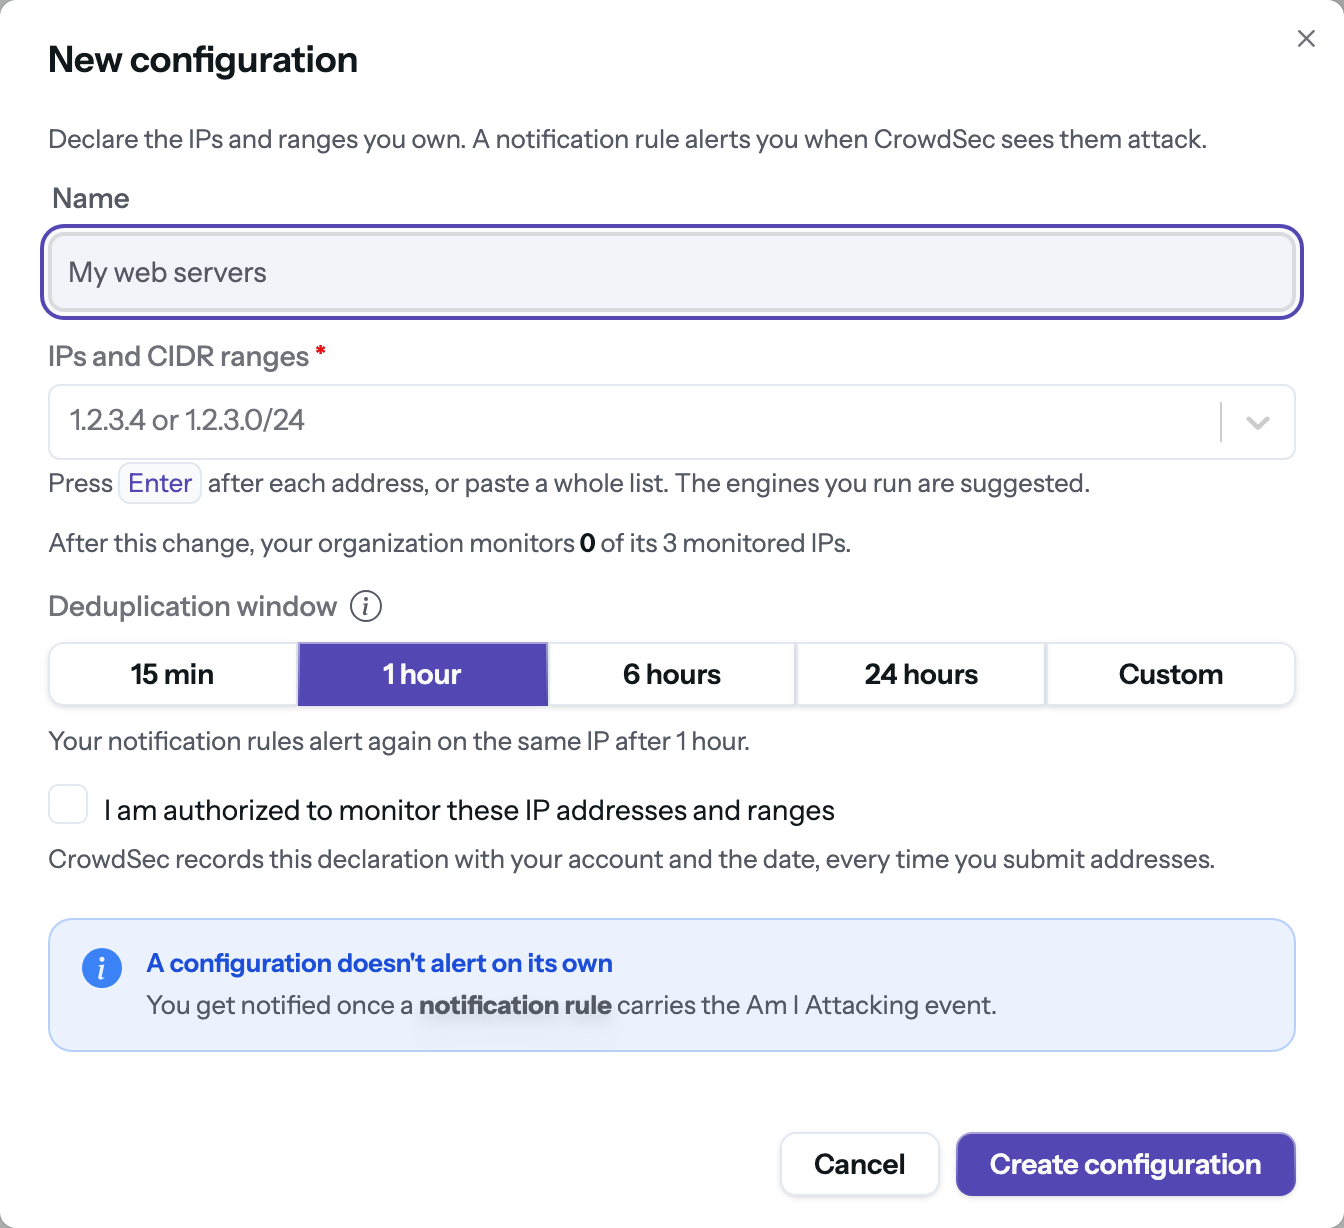
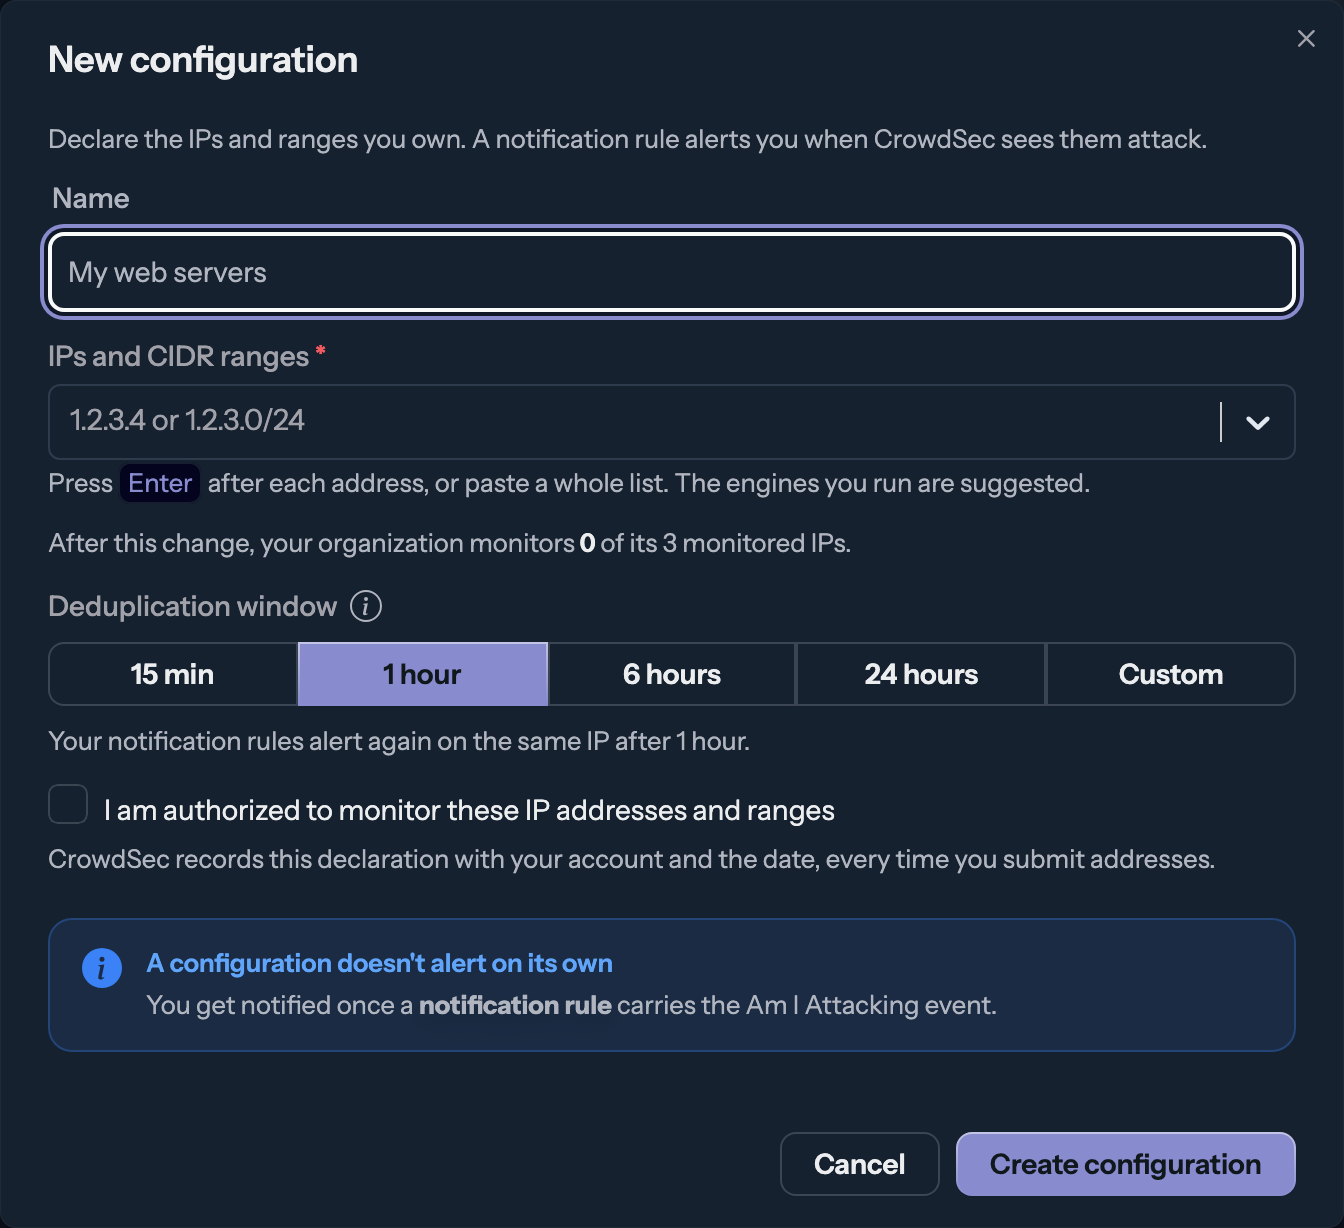
IPs and CIDR ranges
Type an address or a range and press Enter: each entry becomes a chip. Pasting a whole list works too, whatever separates the entries. When you focus the field, the IPs of the Security Engines you run are suggested, one click away.
Entries are checked as you type, and the Console says why one is refused:
| Refused | Why |
|---|---|
| Not a valid IP or CIDR range | Only addresses and ranges, IPv4 or IPv6, can be monitored. |
| Private or reserved | Loopback, link-local, multicast, the private blocks (RFC 1918, 6598) and the documentation blocks (RFC 5737, 3849) have no owner to alert. A range overlapping one of them is refused as a whole. |
| A /16 or wider (a /112 in IPv6) | Monitoring a range that large goes through our sales team: a Contact us link appears under the field. |
How many IPs a range counts for
As soon as the configuration holds a range, a summary tells you how many addresses it monitors in all: a /24 counts for 256, a /32 for one. Each address is counted once. A single IP already inside one of your ranges, or a range nested in a wider one, is marked already inside and adds nothing. IPv4 and IPv6 addresses count alike.
Below the summary, a notice shows how many of your organization's monitored IPs this configuration will use after saving, against your quota.
Deduplication window
After an alert on one of your IPs, further detections on that same IP stay silent for the length of the window. Pick a preset (15 minutes, 1 hour, 6 hours, 24 hours), or choose Custom and set days, hours and minutes. Set every unit to zero to be notified on every detection. The default is one hour.
Declaration of authorization
Before saving, tick the declaration that you are authorized to monitor these addresses. CrowdSec records it with your account, the addresses, the wording you agreed to and the date. It is asked every time addresses are added, on creation and on edition. Renaming a configuration, changing its window or removing addresses asks for nothing.
Monitored IP quota
A Premium plan includes 3 monitored IPs, counted across all your configurations. The gauge in the page header shows how many are used and how many are left. The same gauge sits on the Plan page of the organization settings, under Am I Attacking monitored IPs.
Adding monitored IP slots
When a configuration would exceed the limit, the modal says by how many addresses and quotes the monthly price of the missing slots. The button becomes Buy N slots and create configuration: the slots are added to the subscription first, then the configuration is saved. Expect a few seconds between the two while the new limit propagates. If it takes longer, the slots are bought and the Console asks you to save again in a minute.
Only an organization owner, on an active Premium subscription, can buy slots. Editors see the shortfall and who can fix it. Slots can also be added or removed from the Plan page: an increase applies immediately, prorated over the current billing period. A decrease is scheduled for the end of the billing period, and refused while more addresses are monitored than the new limit would allow.
A Premium subscription can monitor up to 16,384 addresses in all, the equivalent of a /18. Beyond that, the modal invites you to contact us.
Monitoring more than 16 IPs is not covered by the free trial. Buying slots past that number ends the trial at once, and billing starts immediately. The modal warns you before you confirm. See the pricing page for the slot prices.
Get notified
Events reach you through your notification rules. Create a rule in the Threat Hunting category, select the Am I Attacking event, and pick any destination: Email, Slack, Discord or a webhook. The deduplication window of each configuration applies to every destination.
As long as no rule carries the event and reaches an active integration, the page shows Your configurations notify nobody yet. Its Create the rule button opens the rule form with the category, the event and a name already filled in.
Monitor a Security Engine in one click
The quickest way to start is from the engines you already run. Editors and owners find it in three places:
- the banner Is your host attacking? at the top of a Security Engine's page, and the Monitor with Am I Attacking entry of its menu;
- the empty state of the Am I Attacking page, which lists up to three of your engines with a Monitor button.
The modal is prefilled with the engine's IP, which you can complete with other addresses, and picks the destination of the alerts from your active integrations, in this order: Email, Slack, Discord, webhook. With no integration linked yet, it offers to connect one first.
Start monitoring does two things in one go: it adds the IP to a configuration named My Engines, created on the fly with a one-hour deduplication window if it does not exist yet, and it creates a notification rule named Am I Attacking - <engine name> if none carries the event yet, or adds you to the email recipients of the existing rule. If the rule cannot be created, the configuration change is reverted so nothing is left half done.
Read the events
The Am I Attacking page is the history of every event recorded for your organization.
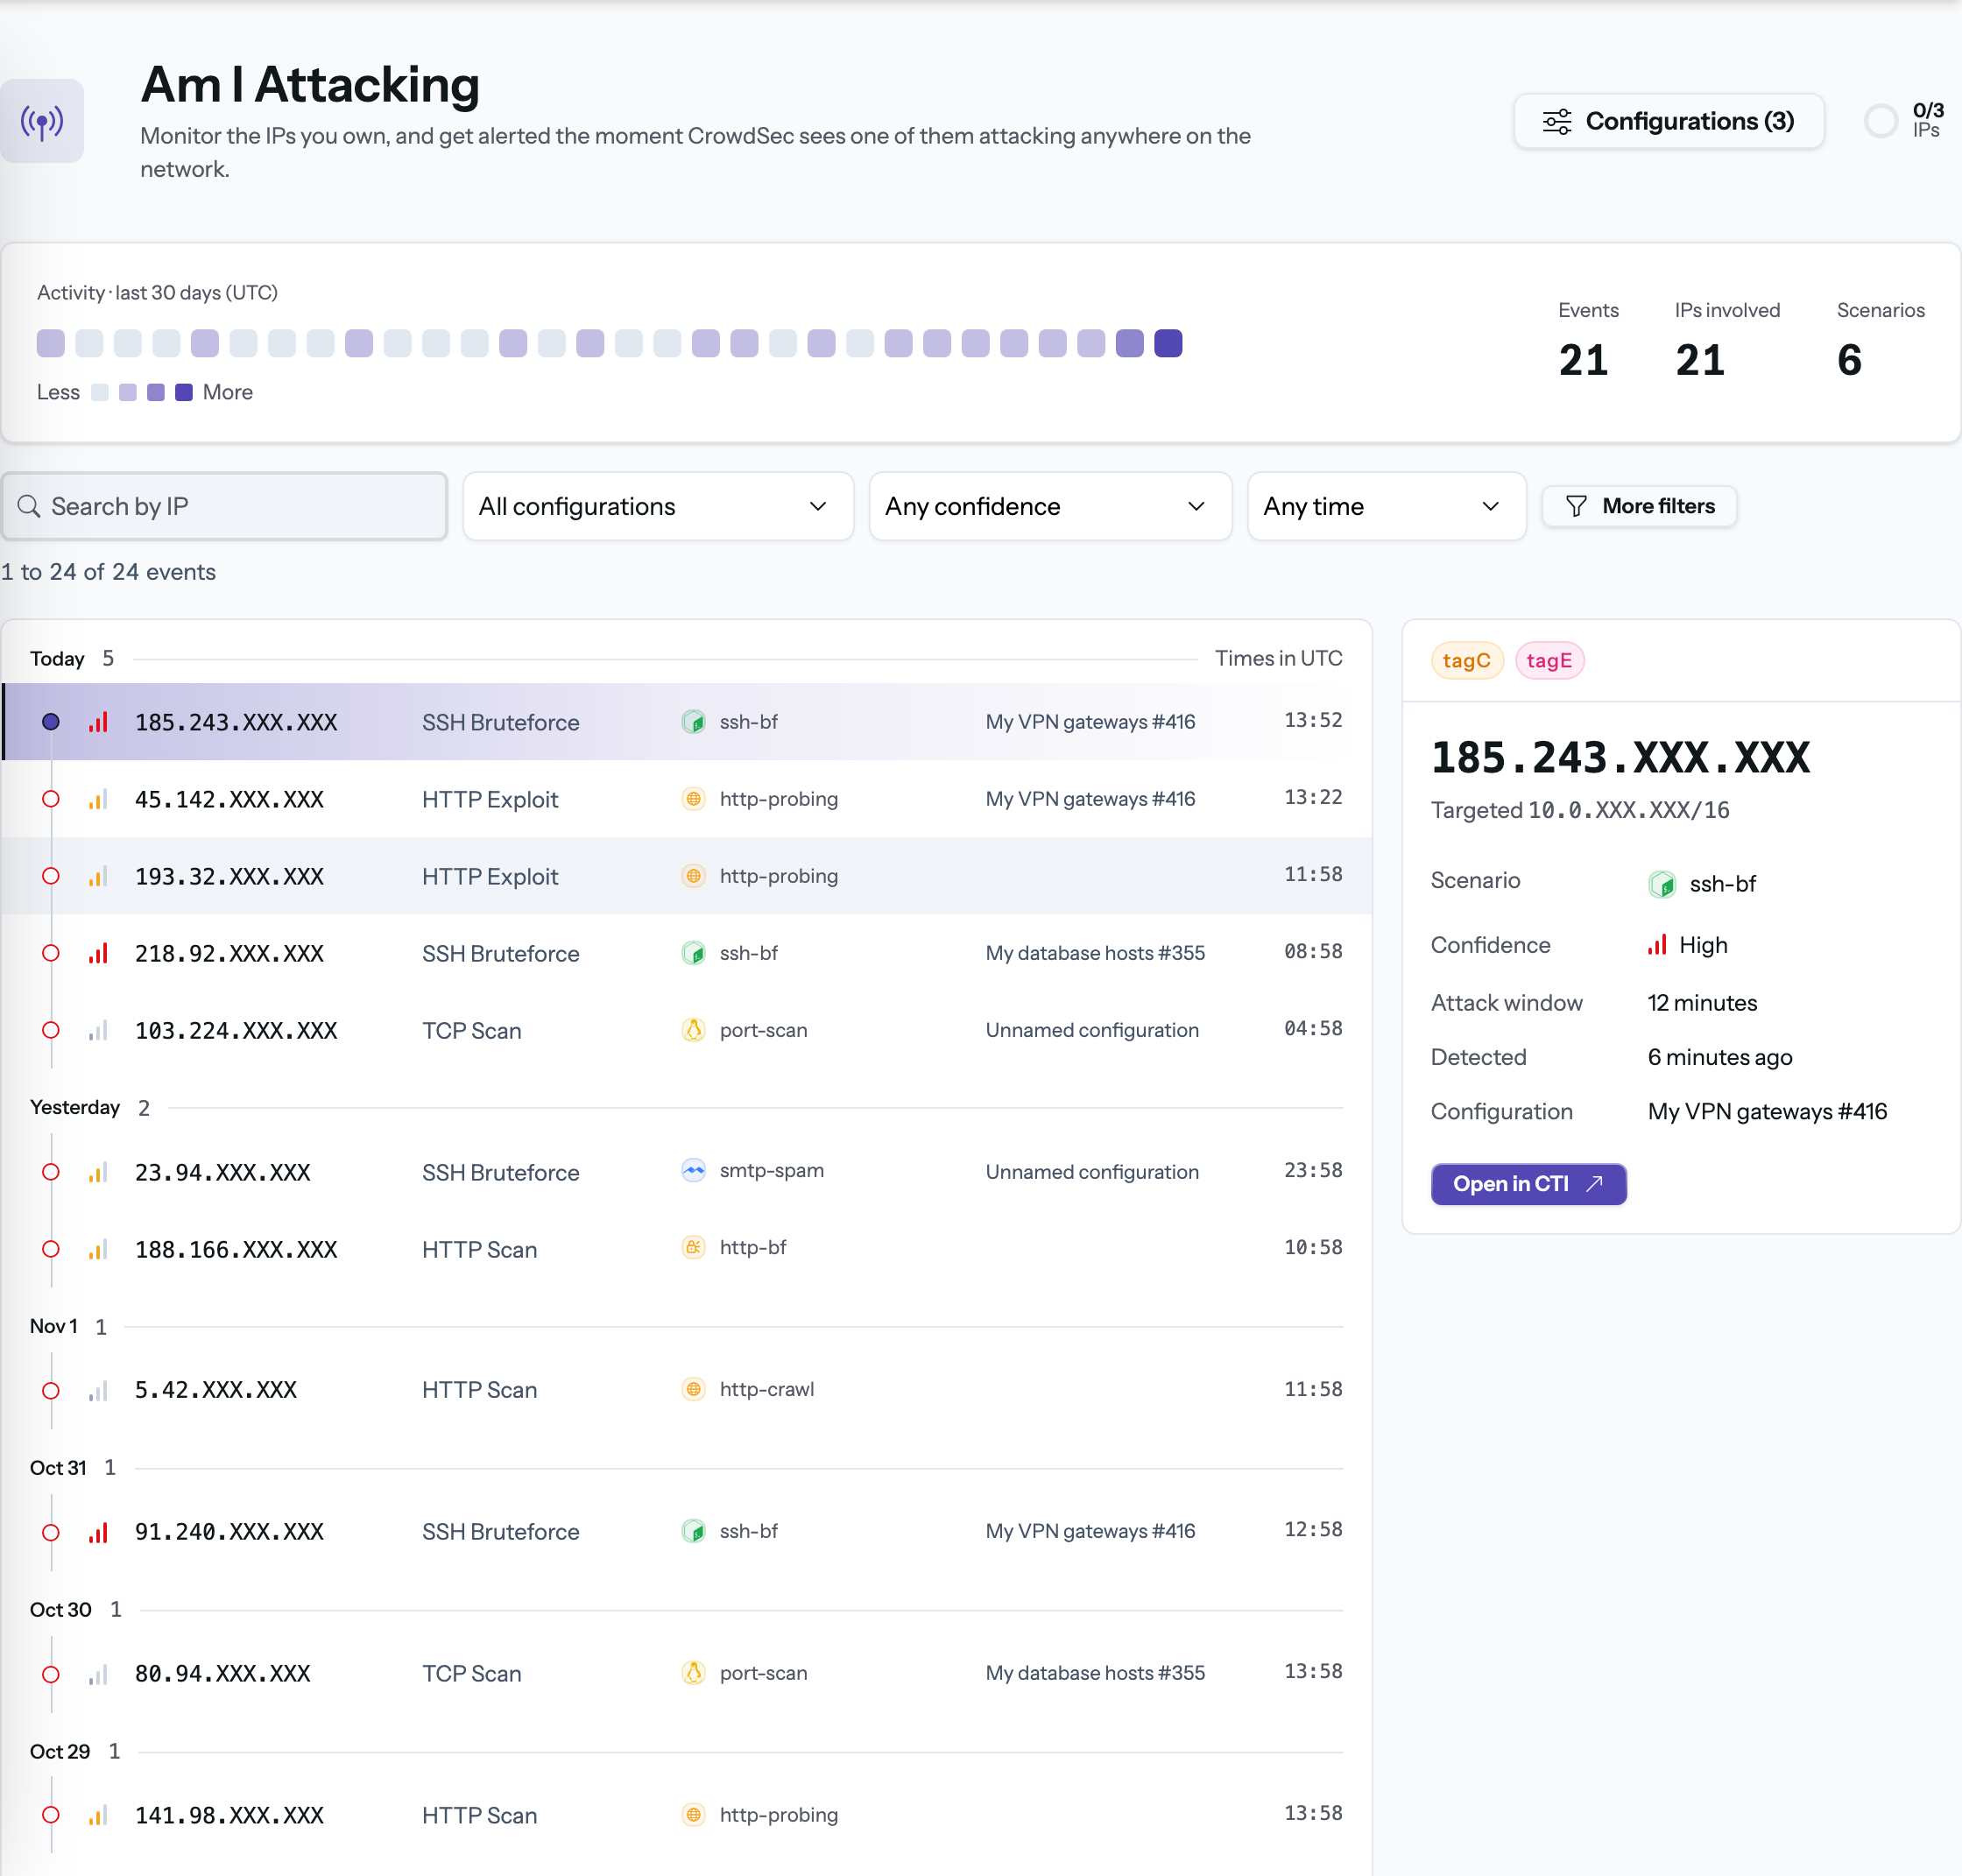
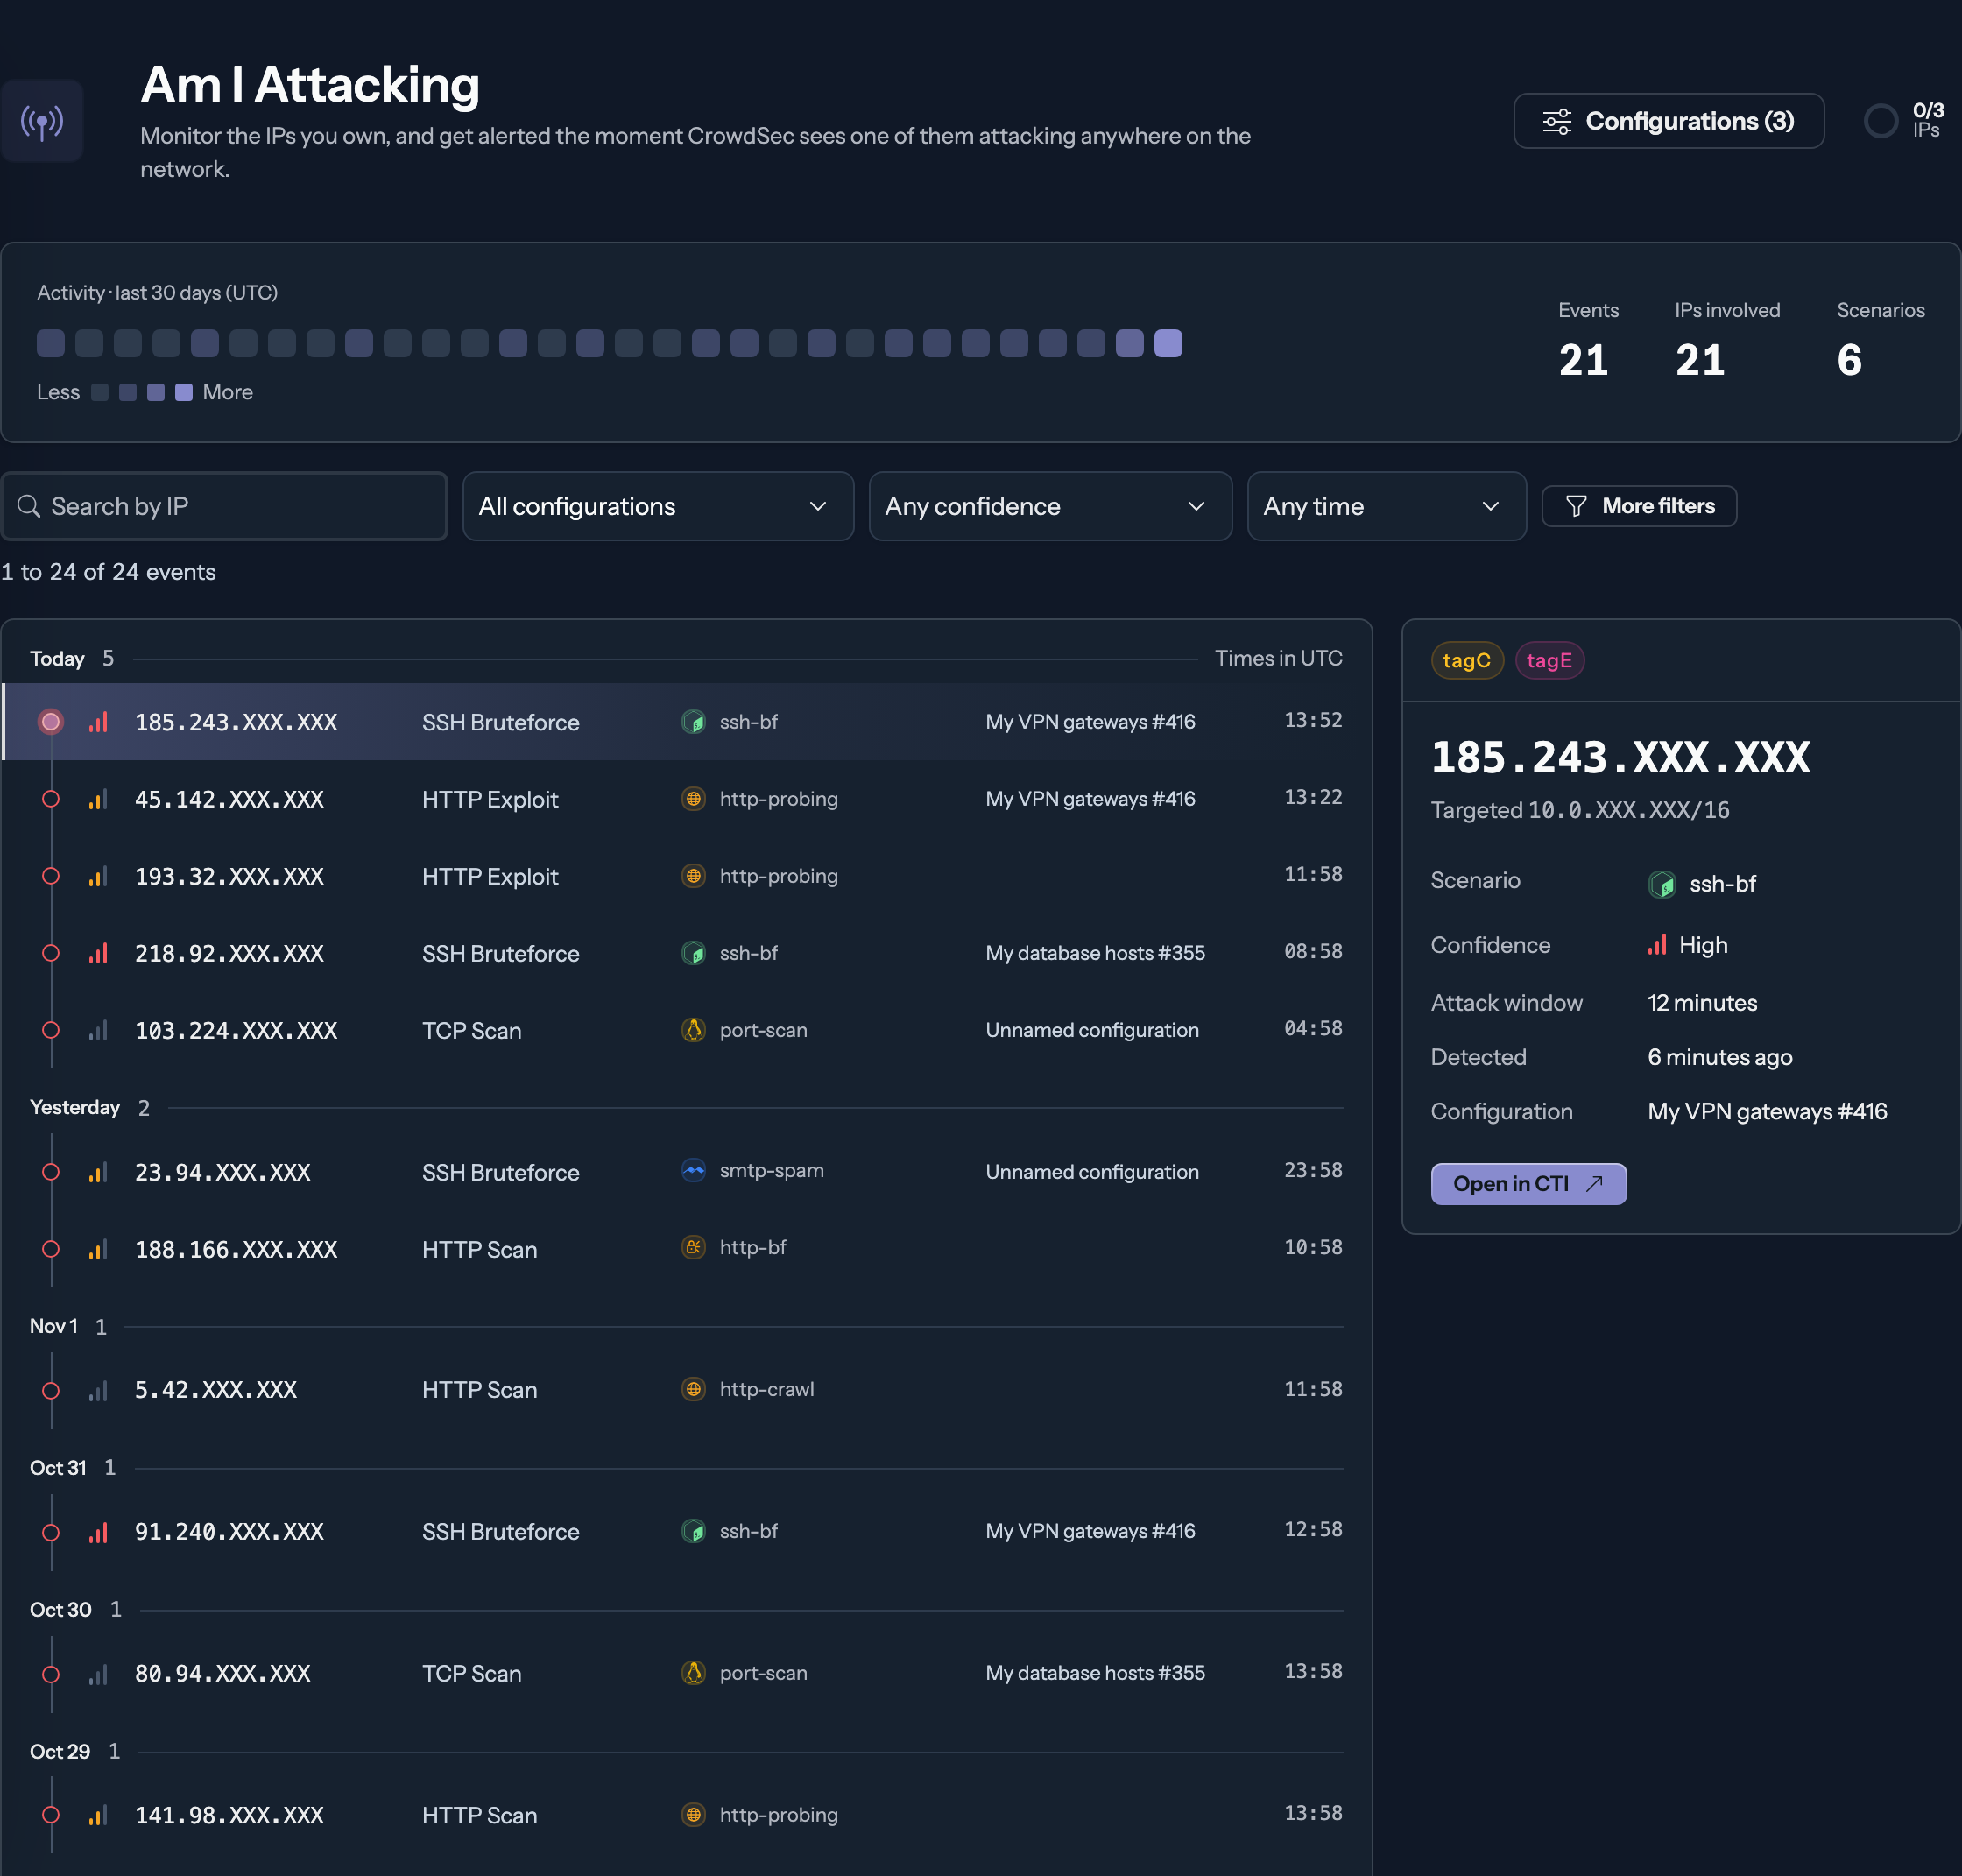
Activity. A heatmap sums the last 30 days, one square per UTC day, next to three counters: events, IPs involved and distinct scenarios. On an organization with a very large number of events, the summary stops reading after a point: the counters then carry a + suffix and read as a floor.
The list. Events are grouped by day, most recent first, 25 per page, with times in UTC. Each row shows the confidence of the detecting scenario, the source IP, the first behavior, the scenario, the configuration the IP belongs to, and the time.
The details. Select a row to see the behaviors with their descriptions, the targeted range (the attacked IP, truncated to its /24), the scenario and its confidence, the attack window, when it was detected, the configuration, and whether the decision was taken manually by the reporting engine. Open in CTI opens the source IP's IP report in a new tab.
Confidence reads as Low below 3, Medium from 3, High from 5. It tells how reliably the scenario tells a real attack from legitimate traffic: a low confidence leaves room for a false positive. An event can outlive its configuration, or come from a source the Console cannot trace back to one. It then reads as Not linked to any of your configurations.
Filters. Narrow the list by source IP, configuration, minimum confidence and period (last 24 hours, 7 days, 30 days, or any time). More filters adds the scenario, the behavior and the targeted range. Clear removes them all.
Before the first event
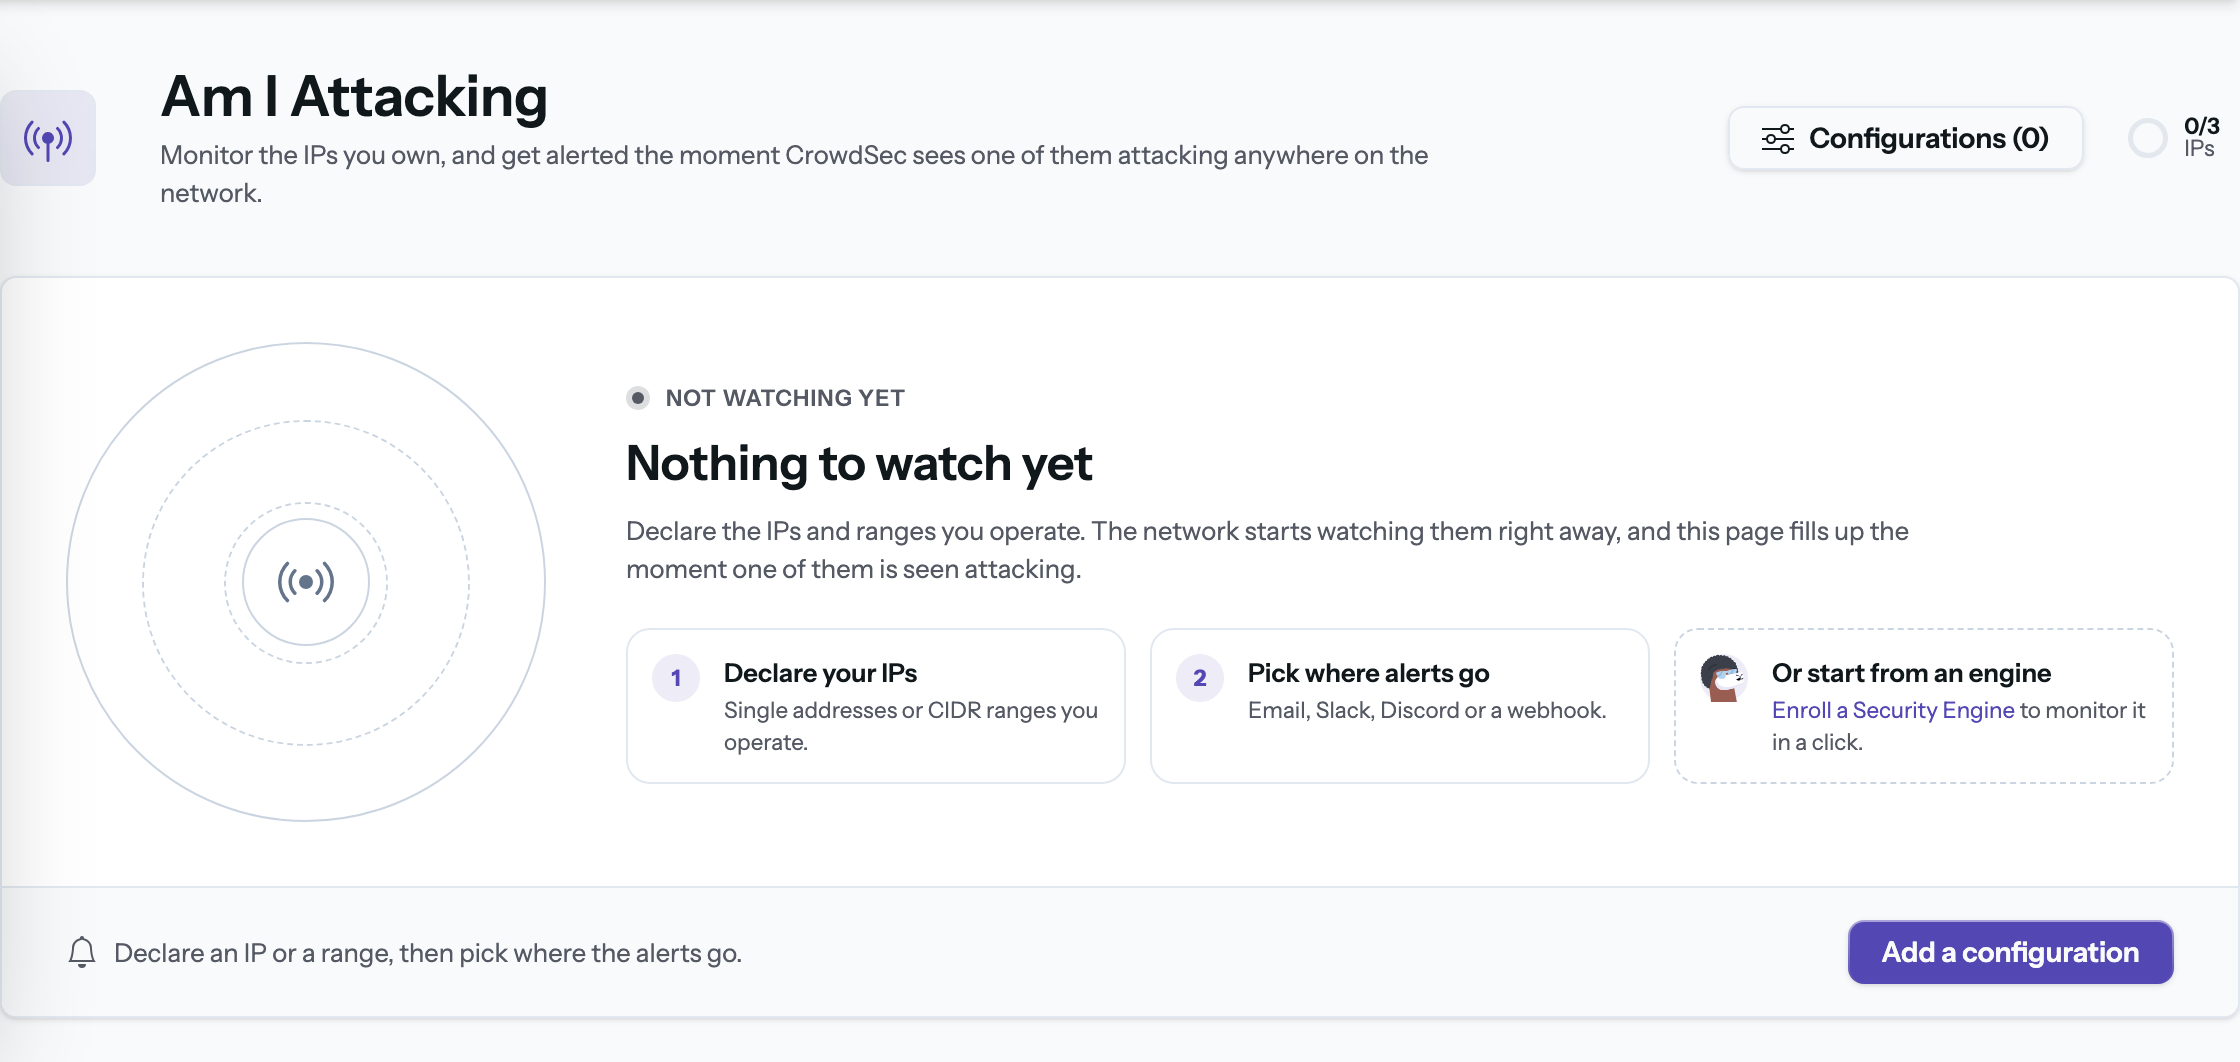
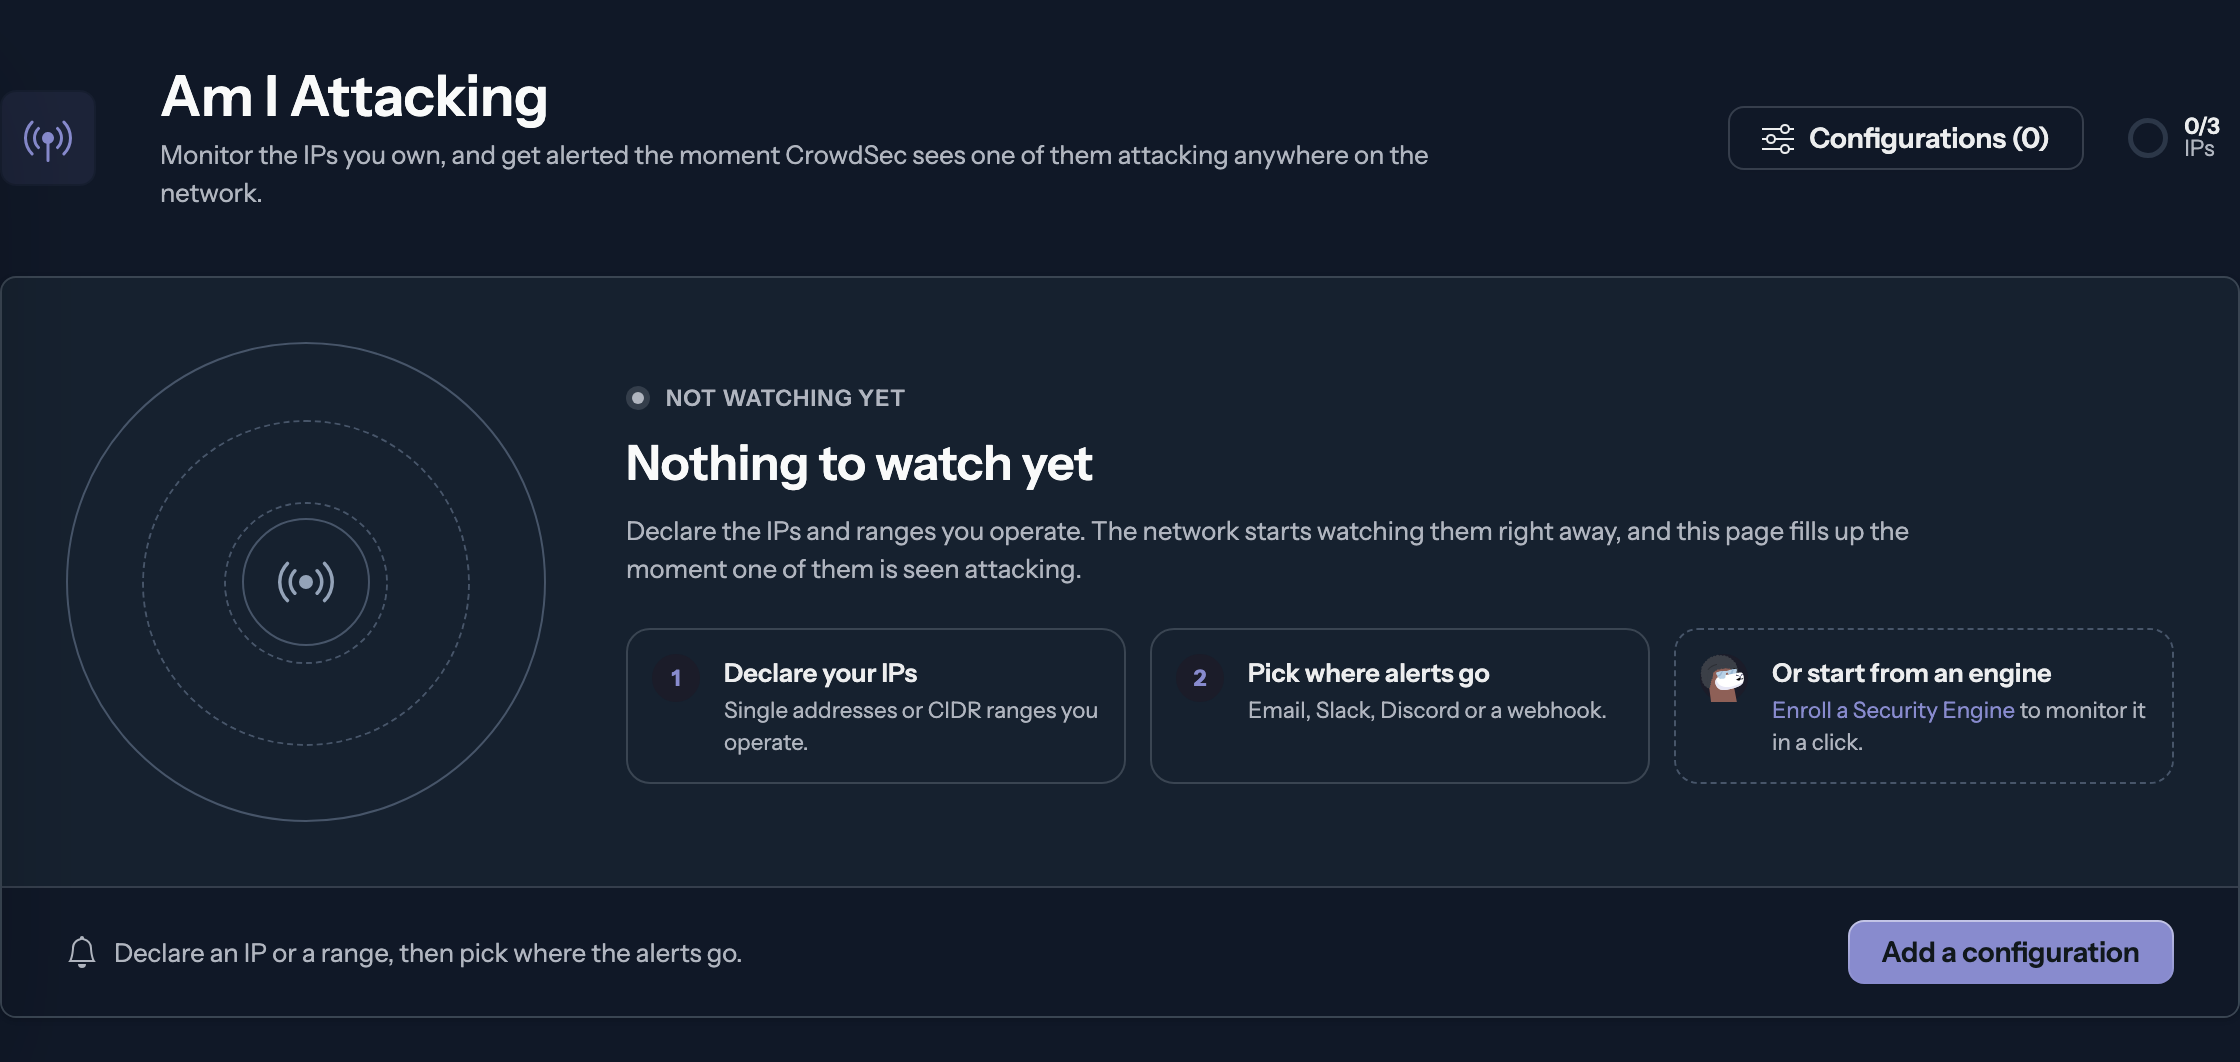
With no configuration yet, the page suggests the Security Engines you run, or walks you through the first declaration.
With configurations and no event, the page confirms that monitoring is active, how many IPs are watched, and whether a rule delivers the alerts. No event is good news.
Manage configurations
Configurations in the page header opens the list. Each line shows the name, the entries and the number of addresses they cover, the deduplication window, and a status: Attack seen with the time of the last event when one happened in the last 7 days, Quiet this week otherwise.
Editors and owners can edit a configuration, which asks the declaration again when addresses come in, or delete it. Deleting stops the monitoring of its addresses at once; past events stay in the history.
Activity log
Every change is recorded in the organization's Activity page, under three entries: configuration created, updated and deleted. Each one names who did it, the configuration, the addresses brought under monitoring or removed (the first ten listed, each linking to its IP report), the number of addresses now monitored, and any change of the deduplication window. When addresses were added, the entry also states that the author declared being authorized to monitor them, and on which date. Purchases, decreases and scheduled decreases of monitored IP slots are logged there too.
Key considerations
- Nothing is sent without a rule. Events are always recorded, but a notification only goes out through a notification rule carrying the Am I Attacking event.
- The declaration is a record. Each acceptance is kept with your account email, the addresses, the exact wording and its date, and it survives the deletion of the configuration, of your account and of the organization.
- An edit replaces the configuration. The addresses and the window you save are the whole configuration; the Monitor Engine modal merges new addresses into My Engines for you.
- Documentation and private ranges cannot be monitored. The RFC 5737 blocks are refused like any reserved range.
- Deduplication is per IP, within a configuration: two of your IPs attacking at the same time produce two notifications.