Remediation Metrics
For your Security Engine to collect and send metrics, make sure you're using CrowdSec v1.6.3 or higher.
Note: Not all Remediation Components report metrics to the CrowdSec Console. For details, refer to the official documentation.The following Remediation Components are compatible with Remediation Metrics: 🔻
Introduction
The Remediation Metrics page offers a clear and comprehensive view of the malicious activity that CrowdSec has detected and remediated on your infrastructure.
It provides key insights into:
- The number and types of attacks
- The impact of remediation measures
- The estimated resources saved by stopping these threats
- The blocklist that contribute to remediate malicious traffic
The page is divided into three main sections:
- Malicious Intents – A breakdown of attack types associated with the IPs that your remediation components blocked.
- Malicious Traffic Dropped/Discarded – Raw and estimated data showing how much malicious traffic has been dropped by your remediation components.
- Projected Resources Saved – An estimate of the resources preserved thanks to traffic being dropped (e.g., storage, bandwidth, log volume).
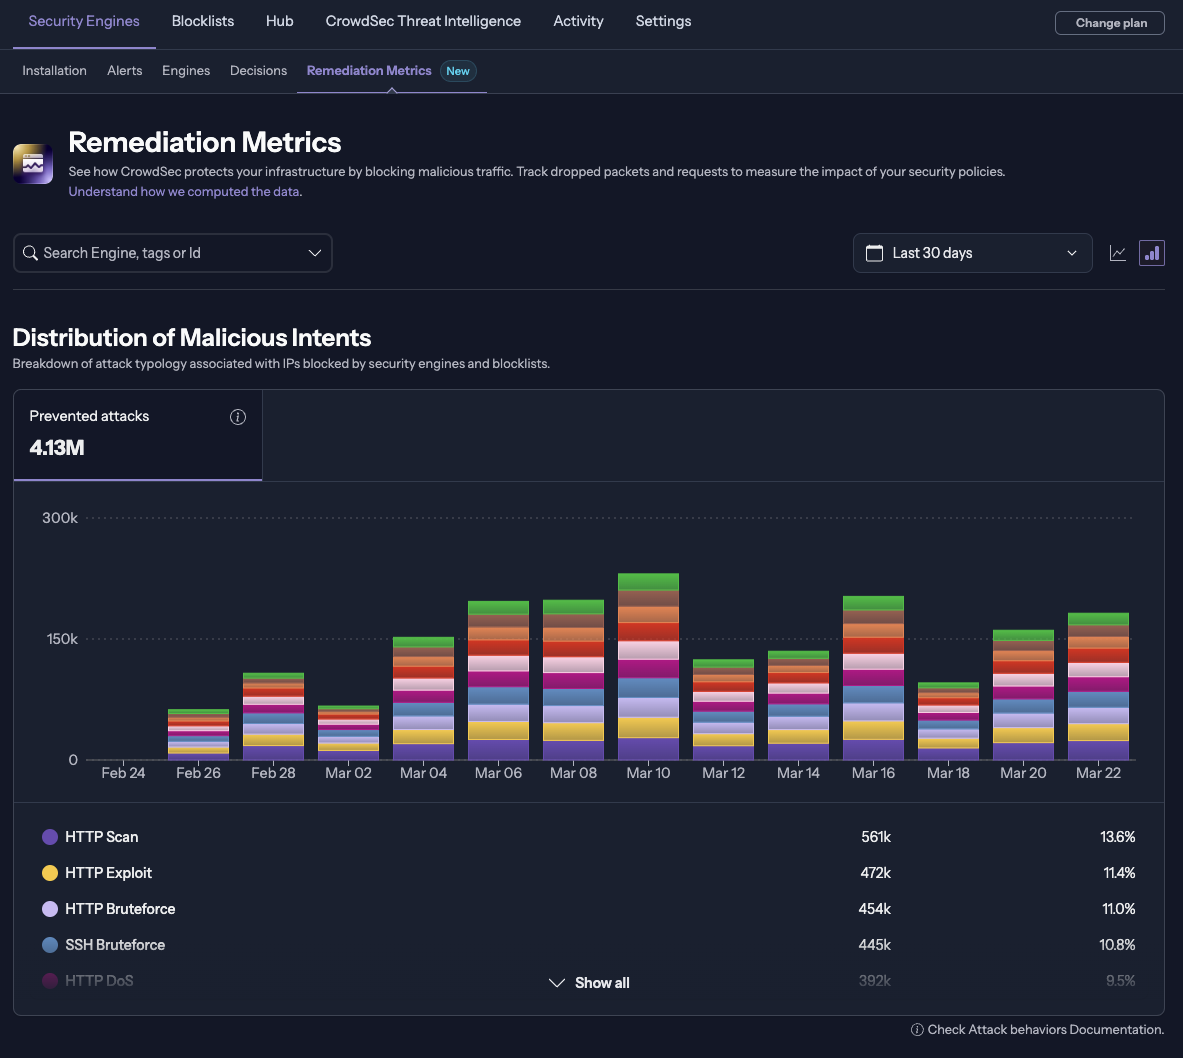
Malicious Intents
At the top of the page, you'll see the Total Prevented Attacks for the selected time period. This gives you an immediate overview of how many threats CrowdSec has detected and remediated.

The Malicious Intents section summarizes what a blocked IP was likely attempting (for example spam, scanning, or brute-force), based on behaviour patterns observed across the CrowdSec network. Because these IPs are blocked, we may not have direct evidence of what they tried in your environment. Treat the intent as an informed estimate derived from community data rather than a record of actions on your system.
Note: We cannot determine the exact action an IP took against your service. The displayed intent is an estimate inferred from broader network observations.
Malicious Traffic Discarded
This section highlights the amount of malicious traffic that has been remediate by your bouncers. It includes both raw and estimated data on discarded requests, packets, and bytes.
- Raw data represents actual traffic dropped by your remediation components (bouncers), powered by blocklists and security engines.
- Estimated data is calculated by applying a coefficient to the raw metrics to provide a projected view of saved resources.
The data estimate is based on the following considerations:
- For OSI L4 (firewall level) bouncers: 7 blocked packets make up about 1 blocked attack attempt (due to tcp-syn retries)
- For OSI L7 (application level) bouncers: 1 blocked request makes up about 1 blocked attack attempt
- 1 blocked attack attempt would result in 10 actual attacks if the attacker wasn't blocked, as most attackers will try a sequence of exploits in rapid succession.
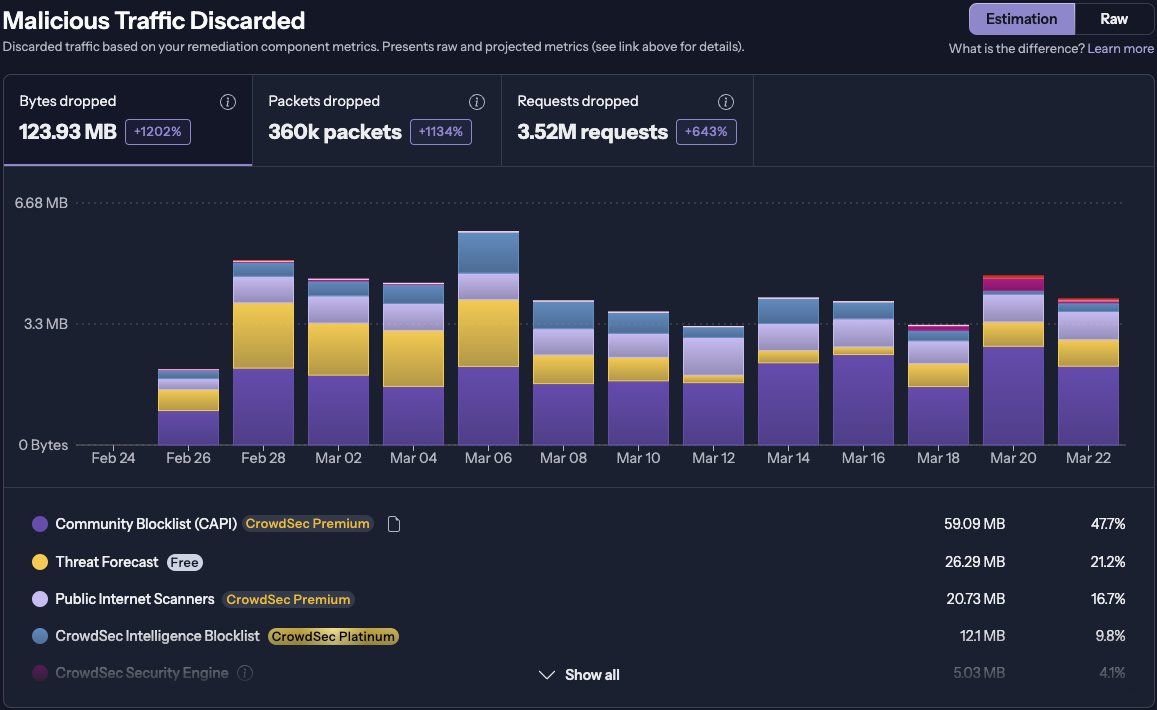
Below the graph, you’ll find a blocklist breakdown, ordered by the amount of traffic each list helped block.
To enhance your protection and block even more threats, explore the full set of CrowdSec Blocklists.
Projected Resources Saved
CrowdSec not only protects you from attacks but also helps you optimize your infrastructure by reducing resource usage.
This section estimates the resources saved as a result of blocking malicious traffic, including:
- Outgoing Traffic – Bandwidth saved by stopping outgoing traffic, also known as egress traffic, from malicious sources.
- Log Lines – Fewer events logged means reduced storage and processing.
- Storage Space – Space saved by avoiding unnecessary log generation.
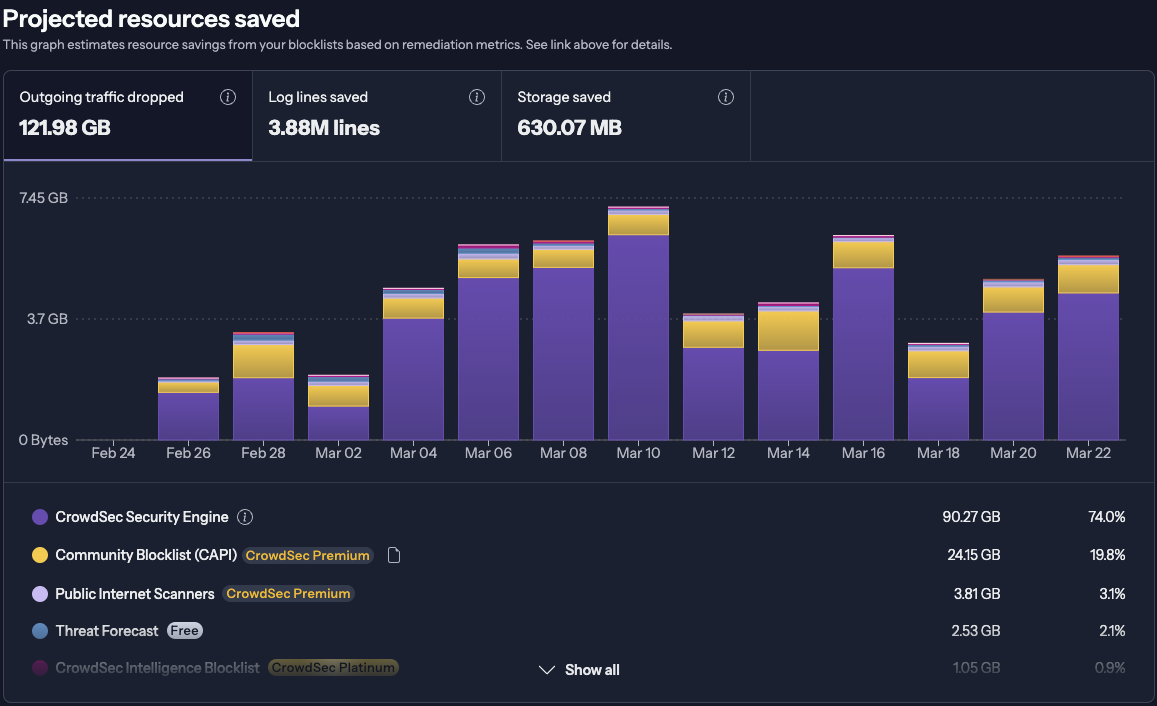
Just like the Malicious Traffic Discarded section, this view includes a blocklist breakdown showing which lists contributed most to resource savings.
To block more threats and save even more resources, consider using additional CrowdSec Blocklists.