Replay Mode
While CrowdSec can be used to monitor "live" logs, it can also be used to replay old log files (replay/forensic mode). It is a great way to test scenario, detect false positives & false negatives or simply generate reporting for a period in the past.
When doing so, CrowdSec will read the logs and extract timestamps from them, so that the scenarios/buckets can be evaluated with the log's timestamps. The resulting overflows will be pushed to the API like any other alert, but the timestamps will be taken from the logs, properly allowing you to view the alerts in their original time line.
you can run:
sudo crowdsec -c /etc/crowdsec/user.yaml -dsn file:///path/to/your/log/file.log -type log_file_type
Where -dsn points to the log file you want to process, and the -type is similar to what you would put in your acquisition's label field, for example:
sudo crowdsec -c /etc/crowdsec/user.yaml -dsn file:///var/log/nginx/2019.log -type nginx
sudo crowdsec -c /etc/crowdsec/user.yaml -dsn file:///var/log/sshd-2019.log -type syslog
sudo crowdsec -c /etc/crowdsec/user.yaml -dns "journalctl://filters=_SYSTEMD_UNIT=ssh.service" -type syslog
When running crowdsec in forensic mode, the alerts will be displayed to stdout, and as well pushed to database:
$ sudo crowdsec -c /etc/crowdsec/user.yaml -dsn file:///var/log/nginx/nginx-2019.log.1 -type nginx
...
INFO[13-11-2020 13:05:23] Ip 123.206.50.249 performed 'crowdsecurity/http-probing' (11 events over 6s) at 2019-01-01 01:37:32 +0100 CET
INFO[13-11-2020 13:05:23] Ip 123.206.50.249 performed 'crowdsecurity/http-backdoors-attempts' (2 events over 1s) at 2019-01-01 01:37:33 +0100 CET
INFO[13-11-2020 13:05:24] (14baeedafc1e44c08b806fc0c1cd92c4/crowdsec) crowdsecurity/http-probing by ip 123.206.50.249 (CN) : 1h ban on Ip 123.206.50.249
INFO[13-11-2020 13:05:24] (14baeedafc1e44c08b806fc0c1cd92c4/crowdsec) crowdsecurity/http-backdoors-attempts by ip 123.206.50.249 (CN) : 1h ban on Ip 123.206.50.249
...
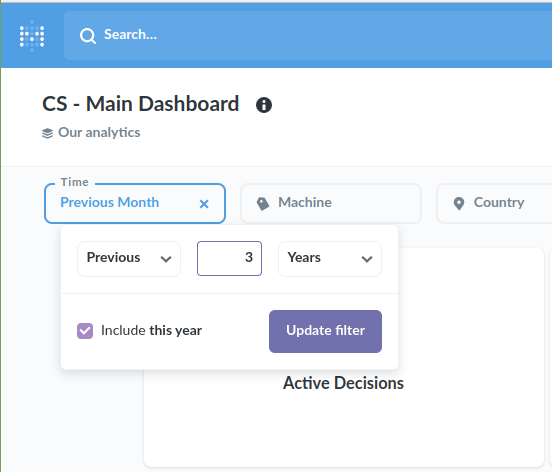
And since these alerts are also pushed to the database, it mean you can view them in metabase, or from cscli!
When using metabase, simply use the time selector to view the appropriate period in the main dashboard:
To work in forensic mode, crowdsec-agent relies on crowdsecurity/dateparse-enrich to parse date formats. See dedicated hub page for supported formats.
Optionally, you can also specify an expression with --transform that will be run before sending a line to the parsers.
For example, to read cloudtrail logs from a S3 bucket, you will need to use this option to generate one event per cloudtrail record:
sudo crowdsec -c /etc/crowdsec/user.yaml --dsn s3://my_cloudtrail_bucket/AWSLogs/ACCOUNT_ID/CloudTrail/REGION/YEAR/MONTH/DAY/CLOUDTRAIL_FILE.json.gz\?max_buffer_size=1048576 --type aws-cloudtrail --transform 'map(JsonExtractSlice(evt.Line.Raw, "Records"), ToJsonString(#))'
It will parse the JSON array Records and generate one event per entry in the array, returning each of them as a string.
max_buffer_size is used to control the maximum length of a line that can be read.
Injecting alerts into an existing database
If you already have a running crowdsec/Local API running and want to inject events into existing database, you can run crowdsec directly:
sudo crowdsec -dsn file://logs/nginx/access.log -type nginx -no-api
Crowdsec will process logs/nginx/access.log and push alerts to the Local API configured in your default configuration file (/etc/crowdsec/config.yaml, see api.client.credentials_path)
Injecting alerts into a new database - no local instance running
If you don't have a service currently running, you can run crowdsec directly:
sudo crowdsec -dsn file://logs/nginx/access.log -type nginx
Crowdsec will start a Local API and process logs/nginx/access.log.
Injecting alerts into a new database - while a local instance is running
If you have a local instance running and you don't want to pollute your existing database, you can configure a separate instance of Local API & database.
Let's copy the existing configuration to edit it:
$ sudo cp /etc/crowdsec/config.yaml ./forensic.yaml
$ emacs ./forensic.yaml
In our file, let's edit the local API & database config to ensure we are not going to pollute the existing data:
$ emacs ./forensic.yaml
...
db_config:
  type: sqlite
  # we edit the db_path to point to a different SQLite database
  db_path: /var/lib/crowdsec/data/crowdsec_alt.db
  # let's comment out the auto-flush (database garbage collection)
  #flush:
  #   max_items: 5000
  #   max_age: 7d

...
api:
  client:
    # we edit credentials_path to point to a local file
    credentials_path: /tmp/local_api_credentials.yaml
  server:
    # we edit the listen_uri so that it doesn't try to listen on the same port as the existing Local API
    listen_uri: 127.0.0.1:8081
With the following edits, we ensure that:
- The SQLite database path will be different: it avoids conflicts if you already had one running locally
- Edit the local api credentials path: we're going to register our machine to the ephemeral Local API
- Edit the listen uri of the local api: it avoids conflicts for listen port in case you already had one running locally
- Comment out the
flushsection: it ensures the database garbage collector won't run and delete the old events you're injecting ;)
Let's create the new database and register a machine to it:
$ touch /tmp/local_api_credentials.yaml
$ cscli -c forensic.yaml machines add --auto
INFO[0000] Machine '...' created successfully
INFO[0000] API credentials dumped to '/tmp/local_api_credentials.yaml'
$ cat /tmp/local_api_credentials.yaml
url: http://127.0.0.1:8081
login: ...
password: ...
Now we can start the new Local API and crowdsec:
$ crowdsec -c ./forensic.yaml -dsn file://github/crowdsec/OLDS/LOGS/nginx/10k_ACCESS_LOGS.log -type nginx
...
INFO[15-11-2020 10:09:20] Ip x.x.x.x performed 'crowdsecurity/http-bad-user-agent' (2 events over 0s) at 2017-10-21 13:58:38 +0200 CEST
INFO[15-11-2020 10:09:20] Ip y.y.y.y performed 'crowdsecurity/http-probing' (11 events over 0s) at 2017-10-23 12:00:34 +0200 CEST
...
And we can even fire a dedicated dashboard to view the data:
$ cscli -c forensic.yaml dashboard setup
INFO[0000] /var/lib/crowdsec/data/metabase.db exists, skip.
INFO[0000] Pulling docker image metabase/metabase:v0.37.0.2
...
INFO[0001] creating container '/crowdsec-metabase'
INFO[0002] waiting for metabase to be up (can take up to a minute)
.........
INFO[0040] Metabase is ready

	URL       : 'http://127.0.0.1:3000'
	username  : 'crowdsec@crowdsec.net'
	password  : ...
Injection alerts into new database - dev env
From a fresh release:
$ tar xvzf crowdsec-release.tgz
$ cd crowdsec-v1.0.0-rc
$ ./test_env.sh
$ cd tests
Install the needed collection(s):
$ ./cscli -c dev.yaml collections install crowdsecurity/nginx
And we can process logs:
$ ./crowdsec -c dev.yaml -dsn file://github/crowdsec/OLDS/LOGS/nginx/10k_ACCESS_LOGS.log -type nginx
INFO[0000] single file mode : log_media=stdout daemonize=true
INFO[15-11-2020 11:18:27] Crowdsec v1.0.0-rc-0ecb142dfffc89b019b6d9044cb7cc5569d12c70
INFO[15-11-2020 11:18:38] Ip x.x.x.x performed 'crowdsecurity/http-sensitive-files' (5 events over 4s) at 2017-10-23 12:35:54 +0200 CEST
INFO[15-11-2020 11:18:39] (test/crowdsec) crowdsecurity/http-probing by ip x.x.x.x (DE) : 1h ban on Ip x.x.x.x
And we can then query the local api (while letting the CrowdSec running):
$ ./cscli -c dev.yaml alerts list
+----+--------------------+---------------------------------------+---------+--------------+-----------+--------------------------------+
| ID |       VALUE        |                REASON                 | COUNTRY |      AS      | DECISIONS |           CREATED AT           |
+----+--------------------+---------------------------------------+---------+--------------+-----------+--------------------------------+
| 28 | Ip:x.x.x.x  | crowdsecurity/http-crawl-non_statics  | DE      |  Linode, LLC | ban:1     | 2017-10-23 12:36:48 +0200      |
|    |                    |                                       |         |              |           | +0200                          |
| 27 | Ip:x.x.x.x  | crowdsecurity/http-sensitive-files    | DE      |  Linode, LLC | ban:1     | 2017-10-23 12:35:50 +0200      |
|    |                    |                                       |         |              |           | +0200                          |
Or even start a dashboard to view data:
$ sudo ./cscli dashboard setup
...
INFO[0002] waiting for metabase to be up (can take up to a minute)
........